The trace stack is a special debugging tool in Visual LISP that keeps a temporary record of the functions that were executed within your program. (The term stack is derived from a computer programming structure of the same name.)
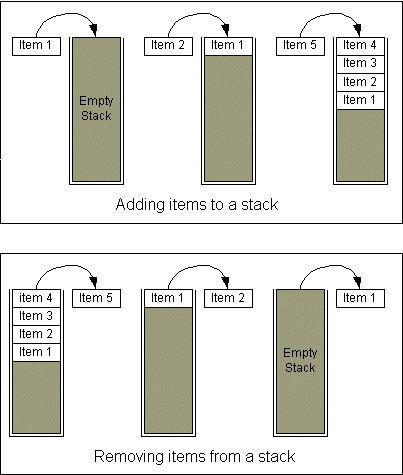
The following figure illustrates adding and removing items from a stack. You can see why a stack structure is often referred to as LIFO—Last In, First Out:
By viewing the stack, you can see what is happening within your program as it is executing (within a suspended break mode) or immediately after it has crashed.
Before a function is invoked at the Console window or AutoCAD Command prompt, the trace stack is empty. The action of invoking a function causes a record, or element, to be placed on the stack. As that function calls additional nested functions, additional elements may be added to the stack. Visual LISP only needs to place elements on the stack when it needs to remember its way out of nested functions.
There are two conditions where it is useful to examine trace stacks.
- When your program is in a suspended state, such as during a breakpoint pause.
- After an error occurs, causing a program to fail.