- Windows > General Editors > Profiler
The Profiler lets you locate performance bottlenecks in your scene by recording and demonstrating in a graph the amount of time that each process consumes.
You can determine when to start and stop recording. You can also save your recording as a text file and reload it in the draw region at a later date. You can perform these tasks via the Profiler window or via the profiler MEL/Python command.
Graph your events in one of the following ways:
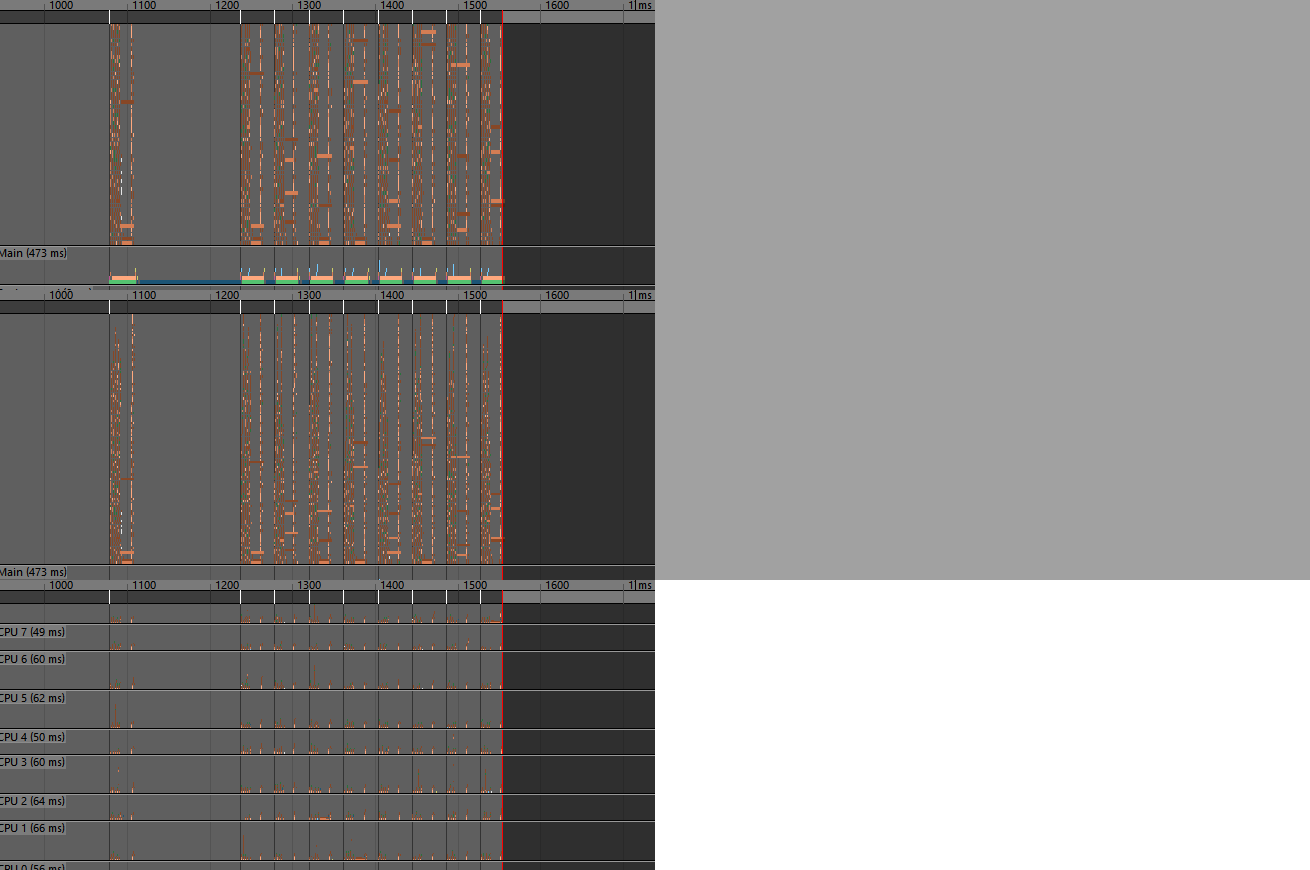
- Category view: displays the activities for different categories such as XGen, Bifrost and Qt. This is the default view.
- CPU view: displays the activities of each of your processors. Select this view to better evaluate multi-threading.
Note: CPU view is unavailable on Mac OSX.
- Thread view: displays the activities of each of your threads. Select this view to evaluate all the activity on a single thread.
For more information on how to record a process and how to work with and interpret your graph, see Profile a scene to improve performance .
You can also instrument procedures in your plug-in for profiling. Instrumentation is the modification of a program to collect information for analysis. Use the profiler -instrumentMel flag to instrument a MEL procedure. Use the MProfiler::MProfilingScope() method to instrument a method in your plug-in. For more information, see Work with the Profiler using MEL/Python and the API.
The following table provides a brief overview of tasks using the Profiler.
| To... | Do this... |
|---|---|
| Record a process |
Click
Play your animation, then click Start Recording. When the buffer is full, recording stops. You can also click Stop Recording. Ctrl + R toggles recording on and off. |
| Switch among different graph views: Category view, CPU view, and Thread view |
Use the hotkeys 1, 2, 3 to switch among view modes. These options are also available from the View menu.
|
| Navigate in the draw region |
Shift + Alt + right-drag up/down to zoom vertically. Shift + Alt + right-drag left/right to zoom horizontally.
|
| Increase the size of the recording buffer | Enter a larger value in the Buffer size attribute. |
| Show or hide specific events in your draw region | Right-click in the draw region and select among the hide and show menu items. See Profiler Marking menu for descriptions of what you can show/hide. |
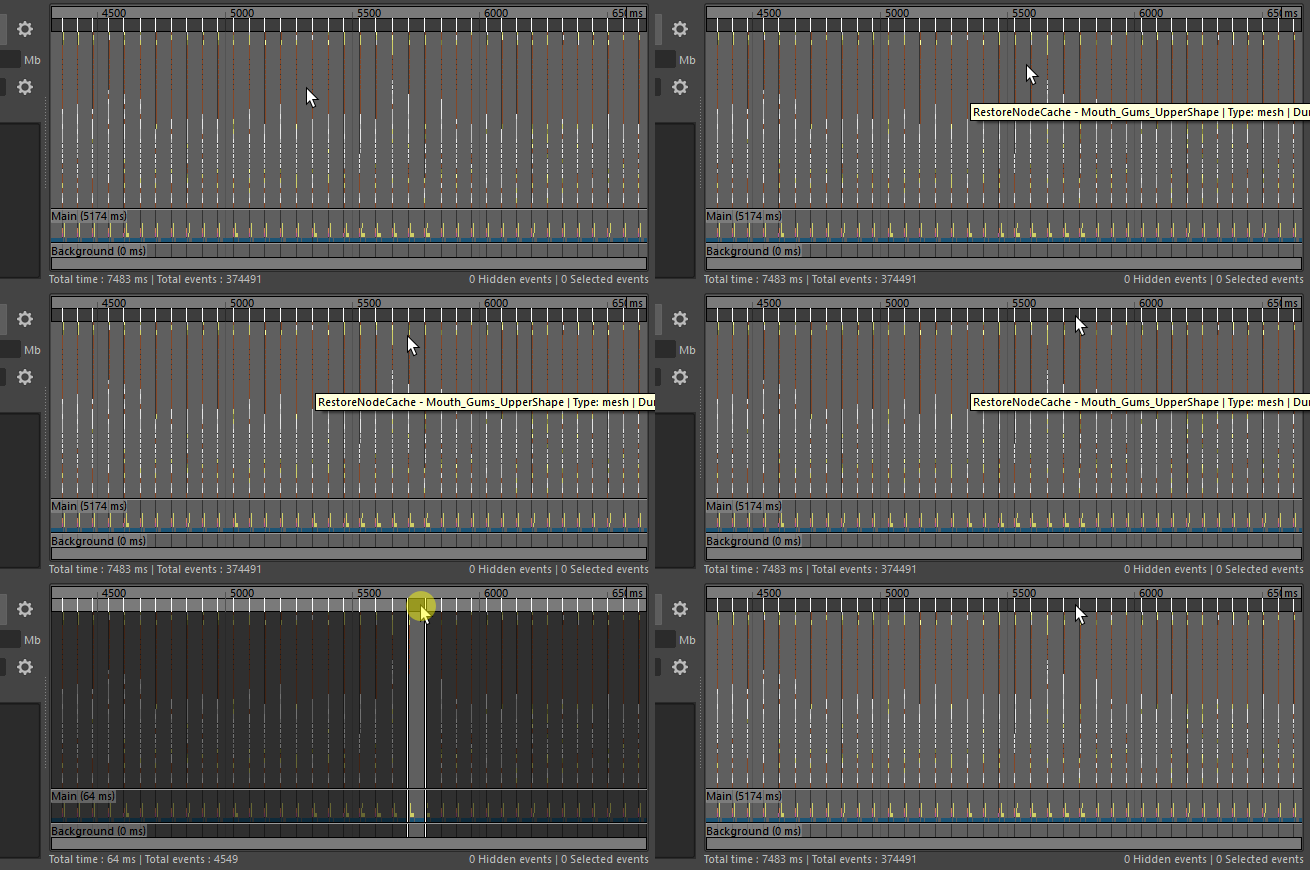
| Isolate or un-isolate a segment |
On the segment bar, click the segment that you want to isolate. Click it again on the segment bar to un-isolate it and return to the default view.
|
| Find an event in the graph | Use the search box or click
 for more search options. for more search options.
|
| Identify an event | See Profiler Colors for a guide to what each event color indicates. |


