The Profiler graph marks the beginning and end of your recording with red vertical lines. In addition, your graph is divided into segments by dark grey vertical lines. These separators allow you to compare the segments, assess whether they are repetitive or similar, and query the number of segments in the profile.
For samples of some typical Profiler events, described, see Profiler interpretation examples. For a guide to what each Profiler color represents, see Profiler Colors.
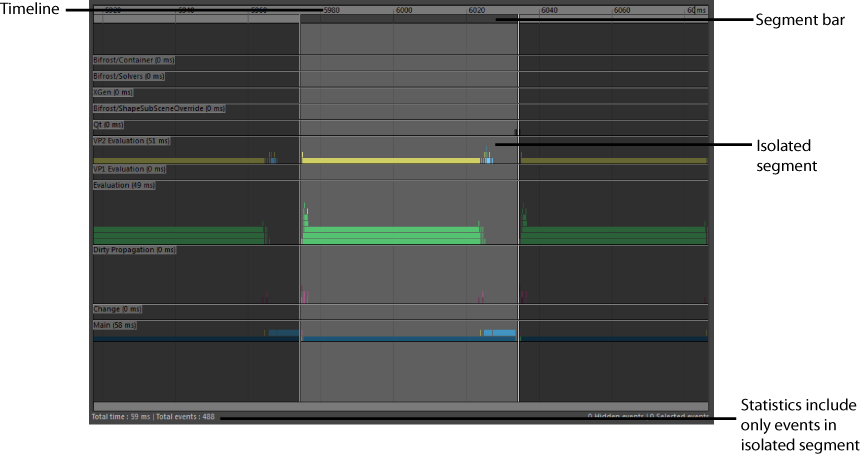
To isolate and inspect a particular segment
Click the segment that you want to isolate on the segment bar. The isolated segment is now highlighted while the rest of the graph appears dark. When a segment is isolated, only the events in the segment are accounted for in the statistical information at the bottom of the Profiler (such as the total number of events).
- To frame all events in this segment, press A.
- To isolate a different segment, click on the next segment that you want to isolate.
- To return to the default view; that is, to un-isolate the segment, click on the segment again on the segment bar. Press A again to zoom out and frame all events in your recording.
- To query the number of segments, run the following command:
profilerTool -q -segmentCount;
You can also isolate a specific segment or return to the default view using commands. See the profilerTool command documentation for more information.
To isolate and inspect a particular event
Click on any event in the graph to see the following information:
- event name
- type of associated DG (dependency graph) node
- duration of the event (real world time between entering and exiting the process)
- average duration of all events with the same name as the selected event; for example, in the case below, the average duration for dbEvaluate - nucleus1
- CPU ID
- Thread ID
dbEvaluate - nucleus1 | Type: nucleus | Duration: 127.15ms [Avg:13.48ms] | CPU:31 | Thread: 5908
When you select an event, its associated DG (dependency graph) node is also selected, and is therefore displayed in the Attribute Editor, Outliner, and Node Editor. This feature is applicable only if a single event is selected.
Click Ctrl+C to copy the event name and its associated DG node and paste it into any text editor.
Not all events have an associated DG node. Only events that have an associated DG node will have a node selected and displayed in the Attribute Editor, Outliner, and Node Editor.
If you select more than one event, the combined event duration time for all the selected events is displayed. The associated DG nodes are not selected when you select multiple events in the Profiler.
The associated DG nodes are also not selected when you load a saved Profiler graph.
Statistical information in the Profiler
In addition to the statistical information provided for each event (for example, its duration and thread ID, the bottom of the Profiler also lists the following information:
- Total time recorded
- Total events recorded
- Number of hidden events
- Number of selected events
Hidden events are not included in the Total time and Total events count. If a segment is isolated, only the events in the isolated segment are included in these statistics. Isolated events are not considered hidden.