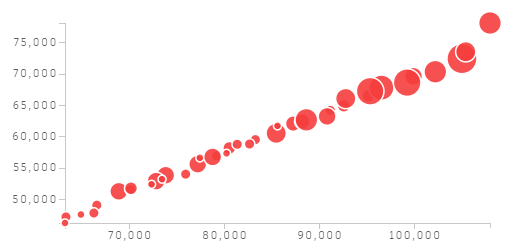
This chart displays the outcomes of a Generative Design study in a chart with one x-axis and one y-axis. The scatterplot lets you control which inputs and outputs to display in the chart.
Access this chart by clicking
 Scatterplot in the Explore Outcomes dialog.

Each outcome is a point on the graph, and you can click each point to see more information about that outcome in the Details pane.
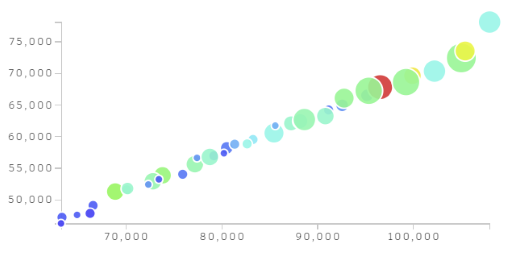
The scatterplot can display data in up to four dimensions: y-axis, x-axis, size, and color. Each option in the drop-down menus represents the inputs and outputs of the study.
You can check which options are inputs and which are outputs by switching to the parallel coordinates chart and looking at the vertical lines: In the
 parallel coordinates chart, the bold vertical lines are outputs and the thin vertical lines are inputs.
In the scatterplot drop-down menus, select options for the y-axis and x-axis to view outcomes in different ways.
Size and color
Display additional data in the chart by picking options in the Size and Color drop-downs. By default, all points are the same color and size.
If you pick an option for Size, the points in the graph will display in different sizes. For example, after Box 1 Height is selected for Size, the size of the point represents the height of box 1 in the outcome: Larger point means higher box height, and smaller point means lower box height.

If you pick an option under Color, the points in the graph will display in different colors, from red (low) to blue (high). For example, after Surface Area is selected for Color, the color of the point represents the size of the surface area in the outcome, ranging from red (smallest) to blue (largest).

When an option for each drop-down is selected, the chart displays data in four ways: y-axis, x-axis, color, and size. In the example below, y-axis represents surface area, x-axis represents floor area, size of a point represents box 1 height, and color of a point represents box 2 position y.
