Results: Plot Temperature across the Hall
In this step, we'll plot the temperature across the hall at the upper bound of the occupied zone.
1. Open the XY Plot dialog by clicking XY Plot from the Planes context panel:

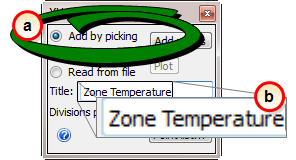
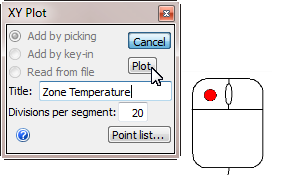
2. Define the XY Plot settings.
- a. Verify that the Add by picking option is selected. (Select it, if not.)
- b. Enter the title: "Zone Temperature"
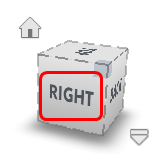
3. To get a better view of the plane, click the Right side of the Navigation Cube.
4. Click the Add points button.
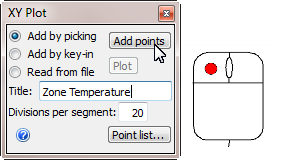
Note: We'll create an XY Plot by selecting points on the results plane. Autodesk® CFD plots the results through these locations.
5. Left click on the results plane, as shown:
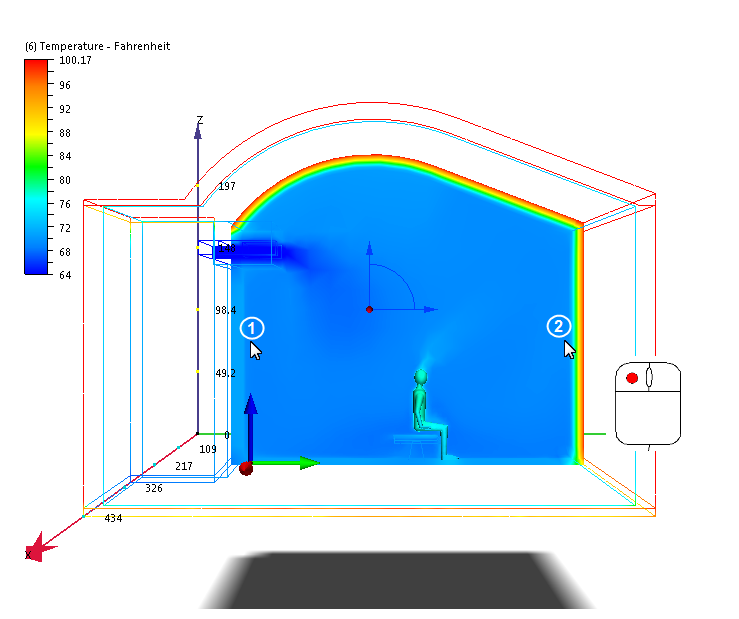
Note: The two points should be 2-3 feet above the sitting occupant's head. This is the upper bound of the occupied zone.
6. Click the Plot button to create the XY plot.
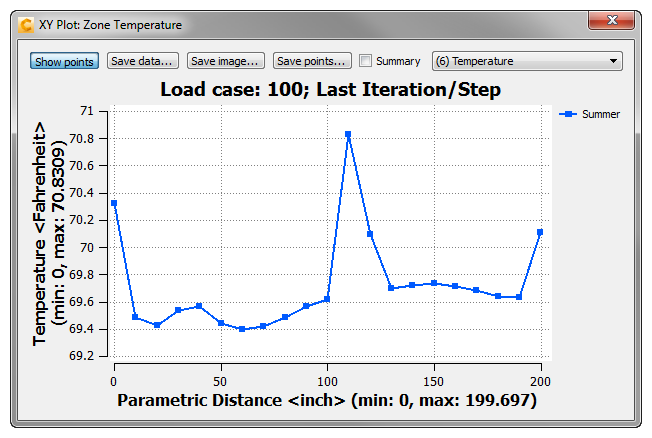
Note: The plot should look like this, but it's ok if yours looks a little different. This just means your points were slightly different from the ones we selected for the graphic.
7. To compare the two design days using this plot, check the Summary box.
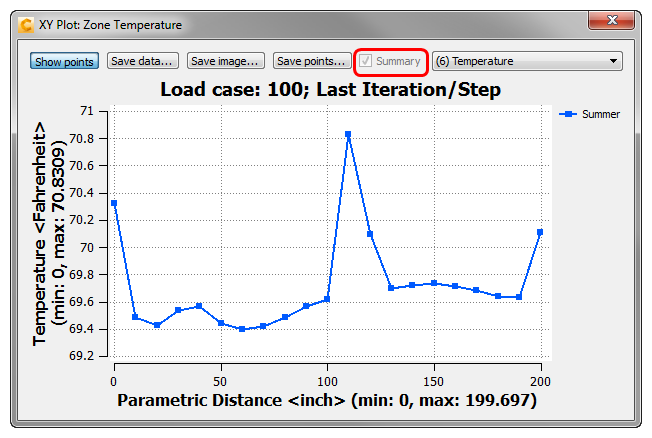
Note: What just happened? In a process similar to the Summary Images, we created a Summary Plot that contains the data from both scenarios. In a few minutes, we'll use the Summary Plot to compare the temperature distributions from the two design days...
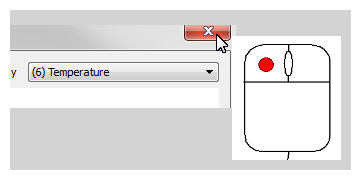
8. Close the XY Plot with the "X" in the upper right corner of the dialog box.
9. To get ready for the next step, you should delete the results plane. Click Remove on the Planes context menu:
