The User Interface
There are a lot of parts in the user interface...but let's focus on what you need to get started quickly.
Video Notes:
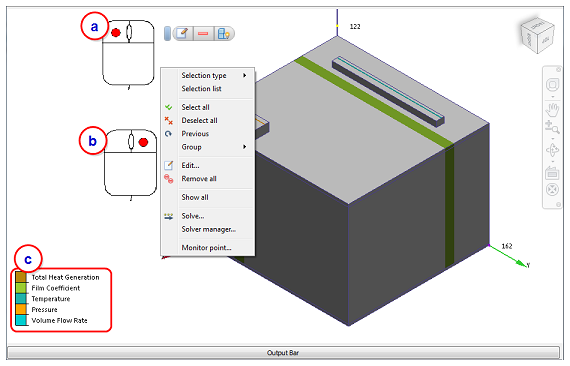
1. Graphics Window
Here are a few important points about the graphics window:
a. Left click = toolbar for applying and removing settings
b. Right click = menu for the current task
c. Use the legend to check your settings.
Note that the left- and right-click commands are also available on the Ribbon.
2. Ribbon
You can do just about everything with the ribbon commands. Here are some things you should know:
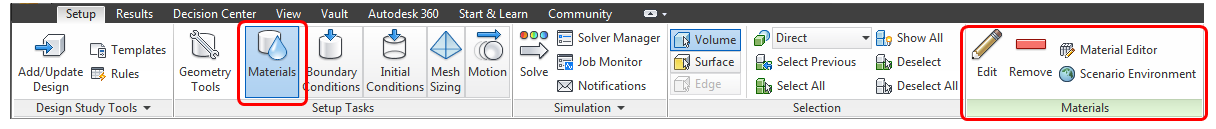
- Use the Setup tab to set up your model. Work from left to right.

- Use the Results tab to view your results. You can use the commands in any order.
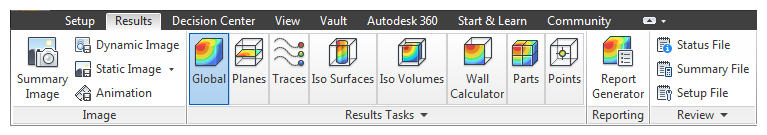
- Each Setup and Results task has a "context ribbon" with commonly used commands:

To learn more about the ribbon, click here.
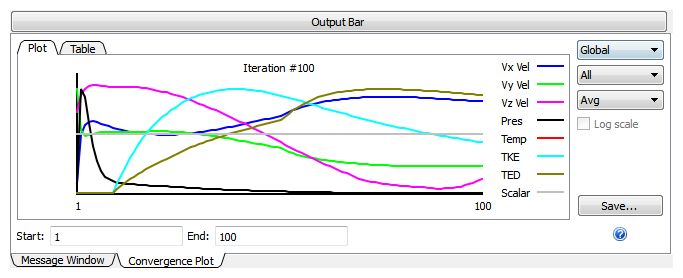
3. Output Bar
You can use the Output Bar, located below the Model window, for several functions:
- At the start and end of the simulation, view status updates in the Message Window.
- Monitor solution progress with the Convergence Plot. When the lines are flat, your simulation is finished ("converged").
- Compare scenario results in the Critical Values and Design Review Center tabs. These are part of the Decision Center.
To learn more about the Output bar, click here.
4. Design Study Bar
This is the "tree." It lists your settings. You can change almost any setting by right clicking on it.

Terminology:
- Scenario = An individual simulation model.
- Design = One or more scenarios that use the same geometry. To analyze a geometry variation, create a new design.
- Design Study = One or more designs. You open, save, and close a design study file.
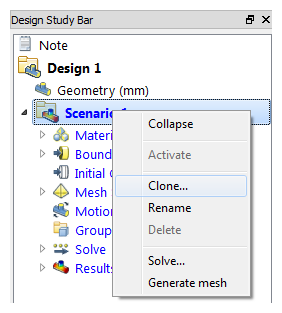
Run multiple scenarios in a design study to vary settings or geometric models. Copy an existing simulation by "cloning" the design or scenario, and modify as needed:
- Right click on the design (for geometric changes) or the scenario (for settings changes).
- Click "Clone."
To learn more about the Design Study bar, click here.
5. Compare Summary Results in the Decision Center
After creating and running multiple scenarios, you can use the Decision Center to compare results from your design iterations.
The Decision Center contains several components:
Summary Items
Use Summary Items to compare images, planes, parts, XY plots, or points from your scenarios:
Click Summary Image to save an image from the current scenario. Autodesk® CFD automatically captures the same image from each scenario in the design study:

Click Make Summary to capture results on planes or parts from the active scenario. Autodesk® CFD automatically captures the same data from each scenario in the design study:

Check Summary on the XY Plot dialog or Points dialog to capture plotted data or results at specific points. Autodesk® CFD automatically plots or captures the same data from each scenario in the design study.
Summary Items automate the capture of images and data in a consistent manner across all scenarios. This consistency allows you to directly compare and evaluate your design iterations.
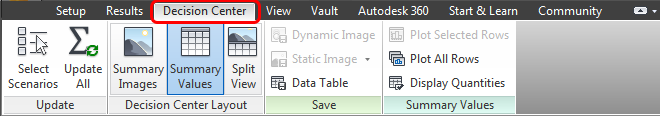
Decision Center
After you have captured summary data, you can manage the data in the Decision Center. Click the Decision Center tab:
The Decision Center appears:
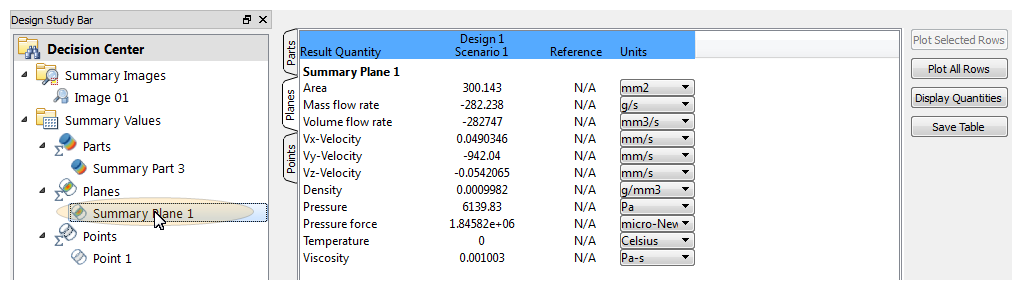
Summary Values
You can use the Summary Value table to review and compare Summary data from the scenarios in the design study:
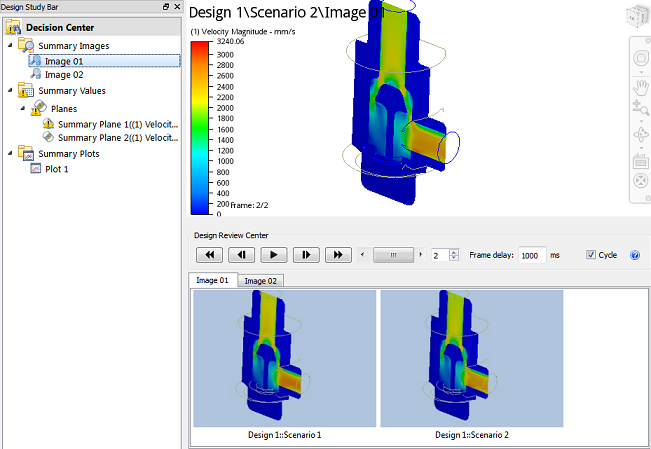
Summary Images
You can use the Design Review Center to compare Summary Images from all scenarios. This allows direct comparison of results created in a consistent manner.
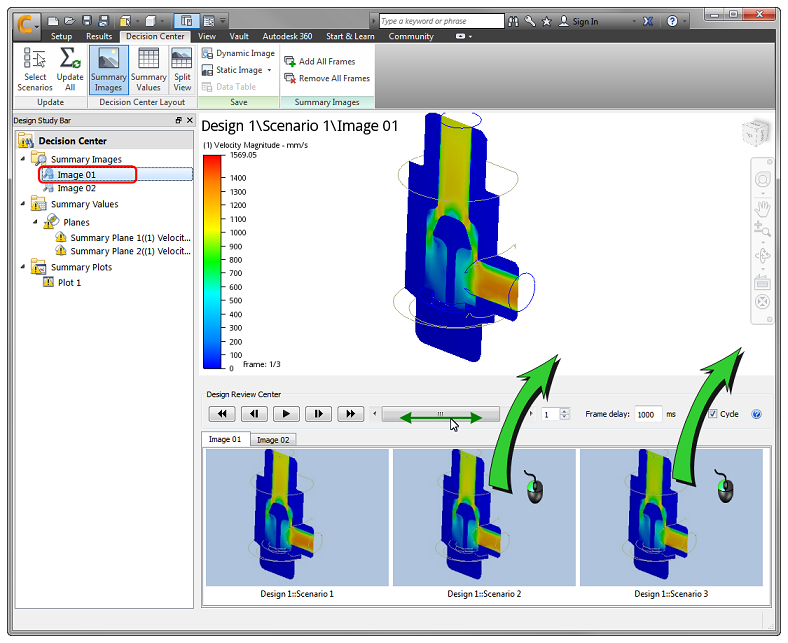
To view results from each scenario, drag the slider. You can also display results side-by-side with the (View tab > Window panel > Viewports) command.
To learn more about the Decision Center, click here.
Next Steps
The next video is about additional resources to help you learn more about Autodesk® CFD.
Alternatively, you can return to the Quick Start home page to watch a different video, do a tutorial, or start applying what you've learned.