The Custom Graph Data View is used to define the data that is displayed on a Custom Graph.
The view is displayed :
- Provided the data required to generate the Custom Graph has not been specified:
- When opening a Custom Graph from the Explorer Window.
- Right-clicking the Graph object on the tree view and choosing Open to open the graph (If the custom graph settings have been specified, the graph opens in the Graph View).
- Right-clicking a Custom Graph object on the tree view and choosing Open As, then Data.
- Clicking the Graph View toggle button (
 ) of the Custom View (when the graph is open in the
Graph View).
) of the Custom View (when the graph is open in the
Graph View).
The pages on the view are:
- Data page - defines the source of the data to be displayed (applies to object per page and simulation per page reports for InfoWorks networks only).
- Layout page - defines the individual parameters to be plotted and scaling options to be used.
- Properties page - defines the Y-axis and the parameters for the graph, such as attributes, titles, and maximum and minimum values (applies to observed / predicted reports only).
- Traces page - defines the style for each trace on the graph via the Trace Style Dialog (applies to object per page and simulation per page reports for InfoWorks networks only).
- X-Axis page - defines the X-axis and its parameters, such as maximum and minimum days/time, autoscale, and axis colour.
- General page - controls the display of grid lines on the graphs, and additional text information at the top and bottom of the page.
Toolbar

Custom Graph View Toolbar
|
|
Graph View toggle. Allows toggling between the data view (Custom graph view) and the related graph. |

|
Probability/Return Period toggle. Applicable to extreme value analysis reports only. Allows toggling between display of Probability along the x axis and display of Return Period. |

|
Y-axis log scale toggle. Applicable to extreme value analysis reports only. Allow toggling between linear scale and logarithmic scale on y-axis. |

|
Applicable to extreme value analysis reports only. Displays the Extreme Values Analysis Table View. |
|
|
Save the changes made anywhere on the Custom Graph View. |
|
|
Go to the desired page. |
|
|
Go to the previous page of the graph view. |
|
|
Go to the next page of the graph view. |
|
|
Launches the Generate Scatter Graph dialog, allowing you to graph the data in a scatter graph. This type of graph can be used to look for a correlation between the two sets of data. |
|
|
Export Traces to CSV. Clicking on this button launches a standard Save As dialog so the user can specify a location and filename. Saving the traces to a CSV format allows graph data to be viewed in other applications. |


Data Page
InfoWorks networks only
The Data page is used for object per page and simulation per page reports only. It is used to define the source of the data to be displayed.
This section lets you define the sources of data displayed on the graphs.
- You can drag one or more simulations into the Sim box.
- You can drag as many selection lists as you want (optional) into the Selection List box. You can select individual objects in the list of selections by clicking on them.
You can also use the
 button to include objects currently selected in the active network in the Selection List box.
- Results Analysis - Results Analysis items in InfoWorks networks can be dragged in the box of the same name (optional).
- In the boxes:
- use the
 button to remove all or only selected objects from the list. If no items in the list are selected when the
button is clicked, all items are removed.
button to remove all or only selected objects from the list. If no items in the list are selected when the
button is clicked, all items are removed.
- use the
 button to browse the current database. The
Common Tree Selection Dialog is displayed.
button to browse the current database. The
Common Tree Selection Dialog is displayed.
- use the
button to add the objects currently selected in the active network to the Selection list box. An item called 'Current' is added to the end of the list. Note that this item will always appear at the end of the list, even when more selection lists are added.
- use the
Layout Page
The Layout page is used to set the parameters to plot on the Graph View and to specify how the graphed data is divided onto different pages. Each graph can display object parameters utilising both left and right axes. The format of the Layout Page will vary with the style of graph selected. See the sections below for more details:
Object per Page Graphs
InfoWorks networks only

Number of Graphs per Page
Set the number of graphs to be plotted per page. A tab for each graph will be displayed from which attributes to be plotted can be defined.
Show Rainfall
Check the Show Rainfall box to include the rainfall profile for each object being graphed.
Show Observed
Check the Show observed box to display TVD connector comparison results (applies when viewing simulations using TSDB data only).
Object Type
This drop-down box allows you to select which object type is to be graphed. The list of available types depends on the selection lists or result analysis objects dragged onto the Data Page of the Custom Graph view.
Graph Attribute Options
For each graph there is a tab for both the left axis and the right axis, from which the attributes to be plotted against each axis can be defined.
- Attribute for axis - select the attributes to be graphed against the selected axis. Only attributes of the same unit type will be plotted on the same axis. Once an attribute has been selected, selection of further attributes will be restricted to those attributes of the same unit type.
- Fixed Lines - select non time varying attributes to be graphed against the selected axis. Only fixed lines of the same unit type as selected attributes will be available for selection.
Scaling Options
The following scaling options are available per axis:
|
Option |
Description |
|---|---|
|
Autoscale |
Check the Autoscale box to adjust the scale of the axis to display the full trace at the largest possible scale. |
|
Autoscale across pages |
Check the Autoscale across pages box to adjust the scale of the axis to allow full display of all traces on any of the graph view pages. Axis scale will be the same for all pages. |
|
Show zero |
Check the Show zero box to include the zero line of the current axis. |
|
Axis colour |
Select a colour from the dropdown palette for the current axis. |
|
Minimum |
Applicable when Autoscale is turned off. Enter the minimum value to be graphed for the current axis. |
|
Maximum |
Applicable when Autoscale is turned off. Enter the maximum value to be graphed for the current axis. |
|
Major Tick Count |
Used to adjust the number of horizontal grid lines to be displayed on the graph. |
|
Minor Tick Count |
Used to adjust the number of tick marks between horizontal grid lines. |
Simulation per Page Graphs
InfoWorks networks only
Number of Graphs per Page
Set the number of graphs to be plotted per page. A tab for each graph will be displayed from which attributes to be plotted can be defined.
Show Rainfall
Check the Show Rainfall box to include the rainfall profile for each object being graphed.
Graph Attribute Options
For each graph there is a tab for both the left axis and the right axis, from which the attributes to be plotted against each axis can be defined.
- Attribute for axis - select the attributes to be graphed against the selected axis. Only attributes of the same unit type will be plotted on the same axis. Once an attribute has been selected, selection of further attributes will be restricted to those attributes of the same unit type.
- Plot attributes at these locations - select the objects for which selected attributes are to be graphed. The list contains all objects in the Selection box of the Data Page. Use the All button to select all objects in the list, the None button to clear all selections or check the boxes to select individual objects.
Scaling Options
The following scaling options are available per axis:
|
Option |
Description |
|---|---|
|
Autoscale |
Check the Autoscale box to adjust the scale of the axis to display the full trace at the largest possible scale. |
|
Autoscale across pages |
Check the Autoscale across pages box to adjust the scale of the axis to allow full display of all traces on any of the graph view pages. Axis scale will be the same for all pages. |
|
Show zero |
Check the Show zero box to include the zero line of the current axis. |
|
Axis colour |
Select a colour from the dropdown palette for the current axis. |
|
Minimum |
Applicable when Autoscale is turned off. Enter the minimum value to be graphed for the current axis. |
|
Maximum |
Applicable when Autoscale is turned off. Enter the maximum value to be graphed for the current axis. |
|
Major Tick Count |
Used to adjust the number of horizontal grid lines to be displayed on the graph. |
|
Minor Tick Count |
Used to adjust the number of tick marks between horizontal grid lines. |
Flexible Graph and Extreme Value Analysis Graph
Flexible style can be used to plot graphs from simulation results and time varying data.
Extreme value analysis style is used to fit a selected statistical distribution to peak values in simulation results and time varying data.
The layout page for both flexible and extreme value analysis styles is very similar. Multiple graphs can be plotted per page, and trace styles and scaling options can be set in this page.
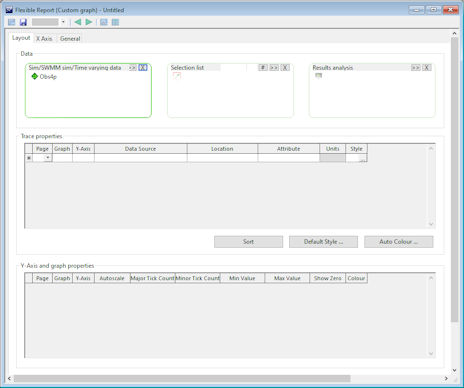
The Data section is used to define the sources of data displayed on the graphs.
- Episode Collection - InfoWorks networks only - select an Episode Collection to be used in conjunction with simulations/time varying data to determine peak values. Applies to Extreme Value Analysis graphs only.
- Sim/SWMM sim/Time varying data - select one or more simulations or time varying data objects. The following table lists the object types that can be selected:
Run (InfoWorks networks only) Observed depth Infiltration (InfoWorks networks only) SWMM Run (SWMM networks only) Observed flow Inflow Sim (InfoWorks networks only Observed velocity Pollutograph (InfoWorks networks only) SWMM sim (SWMM networks only) Rainfall Regulator Level
- Selection List - choose one or more selection lists (optional)
- Results Analysis - InfoWorks networks only - select one or more Results Analysis items (optional)
For these boxes:
- drag and drop database items from the tree view into the box
- use the
button to browse the current database for database items. The
Common Tree Selection dialog is displayed.
- use the
button to remove all selected objects from the list.
- use the
button to add the objects currently selected in the active network to the Selection list box. An item called 'Current' is added to the end of the list. Note that this item will always appear at the end of the list, even if you add more selection lists.
Trace Properties
Validation is carried out in this section so that if data has been entered that cannot be plotted (for example an entry has been added with no location information, or no attribute information), the invalid cell will be highlighted red.
If plotting two attributes on the same graph (a graph is characterised by its page, Y-axis and graph number) and Y-axis, both parameters need to have the same unit.
|
Option |
Description |
|---|---|
|
Page |
Page number in the report where the trace will appear. |
|
Graph |
Graph number on the defined page where the trace will appear. |
|
Y-Axis |
Left or right Y-axis on which the data is to be plotted. |
|
Data Source |
Dropdown list of simulations and Time Varying Data objects selected in the Data section. The selected item specifies the data to be used for creating the trace. |
|
Location |
Depends on the selected Data Source type: Sim - Dropdown list containing all of the objects present in the Selection List box. TVD - Dropdown list containing all of the profile names defined in the Time Varying Data object. Results Analysis - Dropdown list containing all of the objects present in Results Analysis box. The selected item specifies the data to be used for creating the trace. |
|
Attribute |
Dropdown list of attributes that can be graphed for the selected Data Source and Location. Sim - Dropdown list containing all of the available field data that are available for the selected data source and location. TVD excluding rainfall and pollutograph - This field cannot be specified as it is implicitly defined by the TVD object type. For example, an Observed Depth Event is comprised of only one attribute: Obs Depth. Rainfall and pollutograph - When the Data Source type is either a rainfall or an InfoWorks pollutograph event, the attribute must be specified before the location. Once the attribute has been specified, the location (i.e. profile name) can be specified. The selected item specifies the attribute to be used for creating the trace. |
| Threshold |
Applies to Extreme Value Analysis reports only. The y-axis value below which a linear fitting approach will be used. The selected extreme values distribution will be fitted tot he data points above the threshold. |
| Thld Line |
Applies to Extreme Value Analysis reports only. Select the threshold line colour. The threshold will be plotted on the graph as a horizontal line. A vertical line will be plotted at the point at which the curve crosses the threshold. |
| Distribution |
Applies to Extreme Value Analysis reports only. Statistical distribution to which the episode peak values determined from the simulation results/time varying data and episode collection are fitted. There are four distributions to choose from:
|
|
Units |
Read-only cell. Displays the type of units of the attribute to be graphed. The first trace defined for an axis determines the attributes that may be selected for additional traces on the same axis. |
|
Style |
The Style defines the visual properties of the trace. The cell background is coloured the same as the trace line colour. These properties may be set by pressing the
|
|
Sort |
This button allows the grid to be sorted in ascending order by page, graph and y-axis. |
|
Default Style |
This button allows the specification of a default trace style that will be used for all traces for this report. Clicking on this button launches the Trace Style Dialog. When this dialog is open and the OK button clicked, the user will be asked whether or not to apply the line colours from the new default trace style to existing traces. The purpose of this functionality is to allow a user to change, for example, the line style for all traces, but to keep the existing trace colours. |
|
Auto Colour |
This button allows to define traces without regard to trace style. This command will automatically colour traces according to preset settings, making the colours unique either by page or graph. Clicking on this button launches the Auto Colour Traces Dialog. |
 button. This will display the
Y-axis and graph properties
|
Option |
Description |
|---|---|
|
Page |
Read-only property indicating the page number of the Y-axis. |
|
Graph |
Read-only property indicating the graph number of the Y-axis on the defined page. |
|
Y-Axis |
Read-only property indicating the location of the Y-axis (Left or Right). |
|
Autoscale |
Check the Autoscale box to display the graph at the largest possible scale. |
|
Major Tick Count |
Used to adjust the number of horizontal grid lines to be displayed on the graph. Not available when the graph is autoscaled. |
|
Minor Tick Count |
Used to adjust the number of tick marks between horizontal grid lines. Not available when the graph is autoscaled. |
|
Min. Value |
Enter the minimum value to be graphed for the current Y-axis. Not available when the graph is autoscaled. |
|
Max. Value |
Enter the maximum value to be graphed for the current Y-axis. Not available when the graph is autoscaled. |
|
Show zero |
Check the Show zero box to include the zero line of the current Y-axis. ONLY available when the graph is autoscaled. |
|
Colour |
Select a colour from the palette for the current Y-axis. The palette is displayed by clicking on the
|
Observed / Predicted Graph
Observed data
The observed data group contains the following:
- Flow Survey - Drag and drop one flow survey to be plotted from the Explorer Window.
- Auto-Map locations when new observed data is added - Indicates whether or not auto-mapping occurs when new observed data is placed on the droptarget. If this checkbox is ticked, the predicted location name is set to the observed location name in the Locations grid.
- In these boxes, click:
- to remove all selected objects from the list.
- to browse the current database. The
Common Tree Selection Dialog is displayed.
- to add the objects currently selected in the active network to the Selection List box. An item called 'Current' is added to the end of the list. Note that this item will always appear at the end of the list, even if you add more selection lists.
Observed events
When observed data (flow surveys) is specified, the events (or attributes) available for plotting are enabled. Setting the checkbox will plot a trace for the observed event on its event graph.
Predicted data
Drag and drop the simulation data to be plotted here.
Predicted events
When predicted data is specified, the events (or attributes) available for plotting are enabled. Setting the checkbox will plot a trace for the predicted event on its event graph.
Predicted locations
Drag and drop simulation locations (one or more selection lists) that are eligible to be plotted (optional).
Locations
Each row in the grid represents one page on the observed / predicted report. This is known as the memory map. The memory map can either be automatically generated (see Auto-Map locations when new observed data is added checkbox described above) or manually specified.
- Observed location - corresponds to a unique profile name from the flow survey, across each specified observed event.
- Predicted location - dropdown list containing each link location in the specified predicted locations. It is also possible to manually specify a location by typing its name into the grid cell. The name typed-in should correspond to a unique object name from the simulation, across each specified predicted event.
- Rainfall profile - specifies the rainfall profile name to be plotted. You can use the context menu to set all rainfall profiles to the same profile. Right-click on a profile in the Rainfall Profile column to reveal this option.
- Upstream End - if the check-box is ticked, then data from the upstream link end is plotted, as opposed to the downstream link end, which is graphed by default. You can use the context menu to set all of the link ends to upstream or downstream. Right-click on a check box in the Upstream End column to reveal these two options.
Buttons
The following commands support the mapping function:
-
Trace Properties - displays the Trace Properties dialog. Double click on a trace in the list to customise trace colour, style and title using the Trace Style Dialog.
Note: It is not possible to edit the trace titles for observed (rainfall, depth, flow and velocity) events.Click the Default button on the Trace Properties dialog to save the customised traces to be used as the default for all observed vs predicted custom graphs.
Click the Revert button on the Trace Properties dialog to reset any changes made to the trace properties to the currently saved default properties.
- Clear - resets or clears the map.
- Auto-Map - resets the map and automatically generates it from the observed and predicted data (Same functionality as the Auto-Map locations when new observed data is added checkbox, that can be found in the Observed Data section).
- Load Map - allows the loading of a CSV file map by displaying a standard Window Open dialog. Only fields specified in the file map are loaded. For example, it is possible to create a file map of predicted locations only, which will only overlay the memory map with data from the file map.
- Save Map - allows to save the current memory map to a file map (CSV format).
Properties Page
The Properties page is used to define the display properties of the Y-axis and the graph for Observed / Predicted reports. For all other reports, the Y-axis and graph properties are specified in the Layout Page.
|
Option |
Description |
|---|---|
|
Attribute |
Read-only property indicating the attribute (depth, flow, velocity and/or rainfall) to be plotted on the Y-axis. |
|
Title |
The title to be used for the current Y-axis. |
|
Autoscale |
Check the Autoscale box to display the graph at the largest possible scale. |
|
Major Tick Count |
Used to adjust the number of horizontal grid lines to be displayed on the graph. Not available when the graph is autoscaled. |
|
Minor Tick Count |
Used to adjust the number of tick marks between horizontal grid lines. Not available when the graph is autoscaled. |
|
Min. Value |
Enter the minimum value to be graphed for the current Y-axis. Not available when the graph is autoscaled. |
|
Max. Value |
Enter the maximum value to be graphed for the current Y-axis. Not available when the graph is autoscaled. |
|
Show zero |
Check the Show zero box to include the zero line of the current Y-axis. ONLY available when the graph is autoscaled. |
|
Colour |
Select a colour from the palette for the current Y-axis. The palette is displayed by clicking on the
|
Traces Page
InfoWorks networks only
The Traces page is used to define the style for each trace on the graph via the Trace Style Dialog.
For each trace, InfoWorks ICM provides a title and a style:
- for object per page reports, each trace title consists of the name of the run and simulation, the name of the attribute being traced, and a # followed by the number of the graph that the trace is plotted on.
- for simulation per page reports, each trace title consists of the name object, the name of the attribute being traced, and a # followed by the number of the graph that the trace is plotted on.
The trace titles and styles can be changed using the Trace Style dialog.
Double click on a trace on the Traces Page to display the Trace Style Dialog.
Default Style - launches the Trace Style dialog with the default style.
Auto Colour - resets the trace colours to predefined colours.
X Axis Page
The X Axis page is used to define display properties of the X-axis and the graph. The format of the X-axis page will vary with the style of graph selected. See the sections below for more details:
Simulation per page and Flexible graphs
For these types of reports, the X Axis page consists of a grid containing the date/time ranges for each of the pages of the graph report. Each grid row’s date/time range corresponds to the union of the time ranges of all the simulations used on that page. Relative time ranges can be contained on some pages and absolute time ranges on other pages.
For Simulation per Page reports (InfoWorks networks only), each simulation contained in the Sim box on the Data page will be displayed on a separate page in the graph.
For Flexible reports, on the Layout page, you select which simulations or time varying data (such as a rainfall event) you want to use in the Sims/time varying data box and assign which attributes to plot (potentially different graphs on different pages) from these sims/TVDs in the Trace properties grid. All graphs on the same page (possibly from different sims/TVDs) use the same date/time range along the X-axis.
|
Option |
Description |
|---|---|
|
Page |
Read-only property indicating the page number of the report that the grid row applies to. |
|
Autoscale |
Indicates whether or not to automatically scale the X-axis for that particular page of the report. This option is checked by default. |
|
Minimum days |
Disabled and blank for pages using absolute time ranges. For pages with relative times, this option is enabled when the Autoscale option is unchecked. Allows you to enter an integer value (range 0-99) which indicates the minimum number of days to be graphed. |
|
Minimum date |
For pages with relative times, this option is enabled when the Autoscale option is unchecked. Allows you to select a date from the dropdown list for the earliest sim/TVD start date for the page. For pages using absolute time ranges, this option is disabled and blank. The default minimum date used will be the earliest sim/TVD start date for that page. |
|
Minimum time |
For pages with relative times, this option is enabled when the Autoscale option is unchecked. Allows you to enter a time in an HH:MM format for the earliest sim/TVD start time for the page. For pages using absolute time ranges, this option is disabled and blank. The default minimum time used will be the earliest sim/TVD start time for that page. |
|
Maximum days |
Disabled and blank for pages using absolute time ranges. For pages with relative times, this option is enabled when the Autoscale option is unchecked. Allows you to enter a number (range 0-99) which indicates the maximum number of days to be graphed. |
|
Maximum date |
For pages with relative times, this option is enabled when the Autoscale option is unchecked. Allows you to select a date from the dropdown list for the last sim/TVD end date for the page. For pages using absolute time ranges, this option is disabled and blank. The default maximum date used will be the last sim/TVD end date for that page. |
|
Maximum time |
For pages with relative times, this option is enabled when the Autoscale option is unchecked. Allows you to enter a time in an HH:MM format for the last sim/TVD end time for the page. For pages using absolute time ranges, this option is disabled and blank. The default maximum time used will be the last sim/TVD end time for that page. |
|
Repeat dates |
Disabled for pages using relative time ranges. For pages with absolute times, indicates whether the date is shown on the first unit in the X-axis or on every major tick on the X axis. This option is unchecked by default. |
|
Include year |
Disabled for pages using relative time ranges. For pages with absolute times, indicates whether or not the year is to be included as part of the date the X- axis. This option is checked by default. |
|
Long date format |
Disabled for pages using relative time ranges. For pages with absolute times, indicates whether or not to include the name of the month (rather than its number) in the date. This option is unchecked by default. |
|
Colour |
Select a colour from the palette for the current X-axis. The palette is displayed by clicking on the
|
Objects per page and Observed/Predicted Graphs
The X Axis page shows a single date/time range which applies to all pages of the graph for these types of report. This date/time range corresponds to the union of the time ranges of all the sims selected on the Layout page for Observed/Predicted reports or the Data page for Object per Page (InfoWorks networks only) reports. The content of the X Axis page varies depending on whether all the simulation(s) use relative or at least one of them uses absolute times:
Relative times
If all the simulations use relative times, the following X Axis page is displayed:
|
Option |
Description |
|---|---|
|
Axis colour |
The X-axis colour can be selected from the dropdown palette. Default colour is black. |
|
Autoscale |
Indicates whether or not to automatically scale the X-axis. This option is checked by default. |
|
Minimum days/time |
This option is enabled when the Autoscale option is unchecked. The earliest sim start day (between 0 and 99) and time for which data is to be graphed can either be typed in, or you can use the
|
|
Maximum date/time |
Enabled when the Autoscale option is unchecked. The latest sim end day and time, for which data is to be graphed can either be typed in, or you can use the
|
 buttons to specify the day and time. The format for the time is HH:MM.
Absolute times
If at least one of the simulations use absolute times, the following X Axis page is displayed:
|
Option |
Description |
|---|---|
|
Axis colour |
The X-axis colour can be selected from the dropdown palette. Default colour is black. |
|
Autoscale |
Indicates whether or not to automatically scale the X-axis. This option is checked by default. |
|
Minimum date/time |
This option is enabled when the Autoscale option is unchecked. The earliest sim start date for which data is to be graphed for can be selected from the dropdown list. The
|
|
Maximum date/time |
Enabled when the Autoscale option is unchecked. The latest sim end date for which data is to be graphed, can be selected from the dropdown list. The
|
|
Repeat dates |
The date is normally shown on the first unit in the X-axis. Check the box to repeat the date on every major tick on the X axis. Default is unchecked. |
|
Include year |
By default, the day, month and year are included as part of the date the X axis. Check the box if you do not want to include the year. |
|
Long date format |
Check the box to include the name of the month (rather than its number) in the date. Default is unchecked. |
Extreme Value Graphs
|
Option |
Description |
|---|---|
|
Axis colour |
The X-axis colour can be selected from the dropdown palette. Default colour is black. |
|
Autoscale |
Indicates whether or not the X-axis should automatically be scaled. This option is checked by default. |
|
Show zero |
Enabled when the Autoscale option is checked. Indicates whether or not a zero should be included in the scale. By default, this option is unchecked. |
|
Minimum probability |
Enabled when the Autoscale option is unchecked, allowing you to enter a real value as the minimum probability. |
|
Maximum probability |
Enabled when the Autoscale option is unchecked, allowing you to enter a real value as the maximum probability. |
|
Minimum return period (yrs) |
Enabled when the Autoscale option is unchecked, allowing you to enter a real value as the minimum return period. |
|
Maximum return period (yrs) |
Enabled when the Autoscale option is unchecked, allowing you to enter a real value as the maximum return period. |
|
Major Tick Count |
Enabled when the Autoscale option is unchecked. Used to specify the number of vertical grid lines (0 - 10), to be displayed on the graph. |
|
Minor Tick Count |
Enabled when the Autoscale option is unchecked. Used to specify the number of tick marks (0-10) between vertical grid lines. |
General Page
On the General Page you can:
- control the display of the title block at the top of the graph (Title Block)
- use the Show checkbox to show or hide the title block
- control the font face, size and colour for the whole title block
- use the Comment box to add optional text that will appear on the first line
- control whether simulation or time varying data objects objects appear in the title block (Show data objects) and whether their full path is shown or not (Show full path name for data objects)
- control the display of the page heading
- use the Show checkbox to show or hide the graph heading
- control the font face, size and colour of the heading
- control the display of the statistics table area at the bottom of the graph
- use the Show checkbox to show or hide the statistics table area
- control the font face, size and colour for the statistics table area
- control the display of gridlines on the graph plot
- use the Show checkbox to show or hide gridlines
- control the colour of the gridlines
- control the display of the axes titles on the graph plot
- use the Vertical Text for Y-axis Titles check box to change the orientation of Y-axis labels
- control the font face and size of the axes titles
- control the display of the axes labels on the graph plot
- control the font face and size of the axes labels
- control the display of the key on the graph plot (Not available on an Observed/Predicted report)
- control the font face and size of the graph key labels