This spreadsheet style of grid contains a read-only list of Results element 2D objects. It is displayed in the middle of the Network Page beneath the GeoPlan Window.
The grid is automatically generated for each element in the applicable element area when you select a row or bin in the 2D Mesh Element Histogram dialog and click Show grid view.
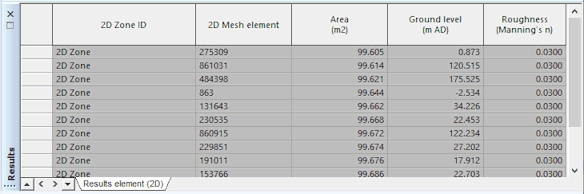
Each Results element 2D object has the same boundary as its corresponding 2D mesh element in the relevant 2D zone, and provides the following mesh element property details:
|
Column |
Description |
|---|---|
| 2D Zone ID | The name of the 2D zone where the mesh element is located. |
| 2D Mesh element | The number used to identify the mesh element. |
| Area | The area of the mesh element. |
| Ground level | The mesh element's ground level. |
| Roughness (Manning's n) | The mesh element's Manning's roughness (n). |
For a more detailed inspection of elements in the 2D mesh, display the 2D Zone Mesh Element Properties dialog by selecting the Properties option from the pop-up menu in the Results Element 2D grid. If 2D simulation results are available for a mesh element, these will also be displayed in the 2D Zone Mesh Element Properties dialog.
See Viewing a 2D Mesh Element Histogram topic in the InfoWorks ICM help for information about using the histogram.