In InfoAsset Manager, you can easily create and save customised graphs.
Graphs are stored in the current database.
Creating a New Graph
In the InfoAsset Manager tree view :
- Right-click on a Asset Group.
- Select New
 Graph.
- The New Name - Graph dialog is displayed. Type in a name for the graph and click OK.
- The new graph object appears in the tree view.
Opening a new Graph
When a new Saved Graph is opened it does not contain the data needed to create a graph, so only the Graph Settings dialog can be opened. Open the dialog using one of the following methods:
- Right-click on the Graph object in the Explorer Window and select Open from the popup menu.
- Drag the Graph object into the main window.
Once the required data to create the graph has been added to the Graph Settings dialog, the graph can be displayed by the following methods:
- Drag the graph onto the GeoPlan Window of the network for which the graph is to be produced.
- Open the Graph Settings Dialog by dragging the Graph object into the Main Window and click Show Graph to produce a graph for the current network
Setting Up New Graph Data
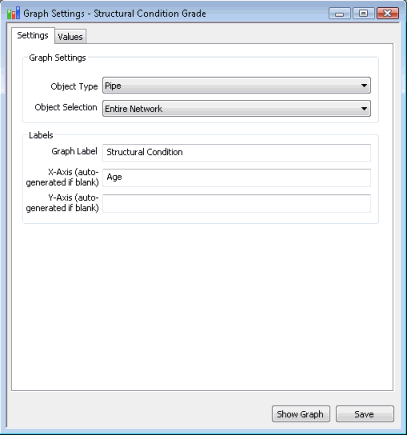
Graphs are set up on the Graph Settings dialog.
The pages on the Graph Settings Dialog are:
- Settings Page - defines which network object types are to be graphed and the labelling to be used for the graph title and axes.
- Values Page - defines the type of graph to be plotted and the parameters to be plotted.
Display properties of the graph such as axes, traces, page title and overall styles are set up in the Graph Properties dialog. The dialog is displayed by right clicking on the Graph View and choosing Graph Properties from the popup menu.
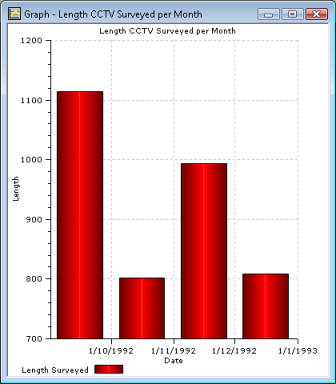
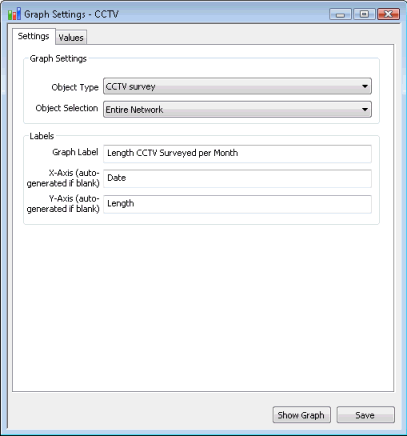
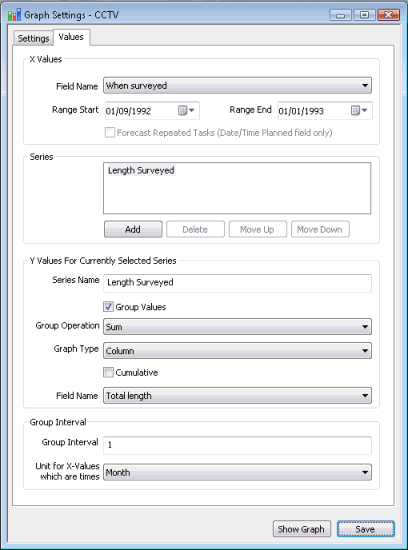
Example 1 - Graphing length of pipe surveyed per month for a given date range
This example demonstrates how a graph can be set up to display the total length of pipes that have been CCTV surveyed on a monthly basis for a range of dates.
Objects to be graphed, graph title and axes titles are specified on the Settings Page of the Graph Settings dialog.
Grouping of the CCTV Surveys by date surveyed and calculation of the total length surveyed in a month is defined on the Values Page of the Graph Settings dialog.
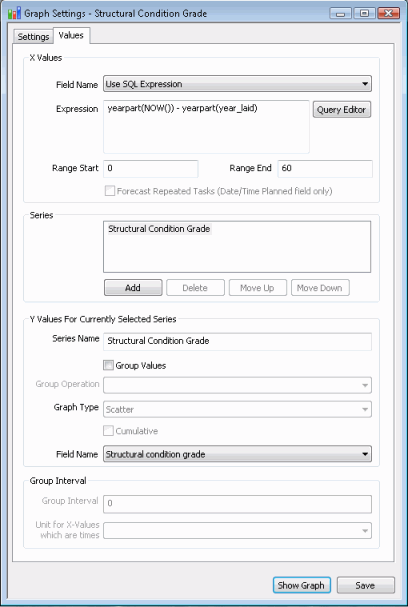
Example 2 - Graphing age of pipe against structural condition
This example demonstrates how a graph can be set up to display a scatter graph of pipe age against condition.
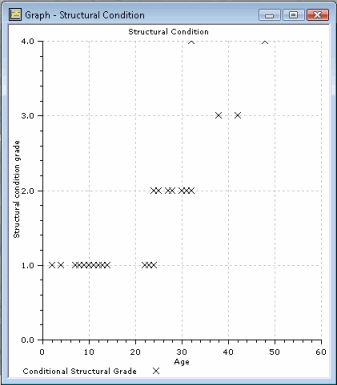
Objects to be graphed, graph title and axes titles are specified on the Settings Page of the Graph Settings dialog.
An SQL Expression to calculate the age of the pipe is defined on the Values Page of the Graph Settings dialog.