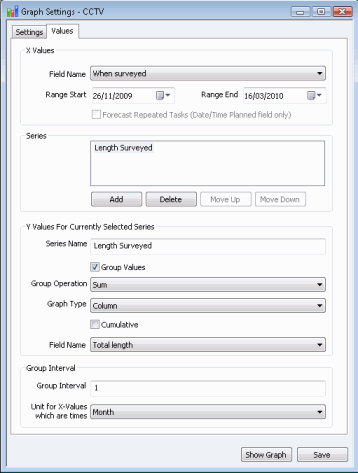
The Values Page of the Graph Settings Dialog is used to define the type of graph and which parameters are to be plotted.
The objects to be graphed and graph title and axes labelling is defined in the Settings Page of the dialog.
Show me

X Values
This section is used to determine which values are to be plotted along the x-axis
- Field Name - select the field to be plotted along the x-axis of the graph. The dropdown list contains fields applicable to the object type selected in the Object Type field on the Settings Page. Alternatively, choose the Use SQL Expression option to calculate X values from object fields.
- Expression - displayed when the Use SQL Expression option is chosen from the Field Name field. Enter an SQL expression to calculate the X values that are to be plotted on the graph. Click the Query Editor button to display the Query Editor Dialog to aid in building and testing the expression.
- Range Start / Range End - can be used to define the range of values to be plotted (start and end of the x-axis).
- Forecast Repeated Tasks (Date/Time Planned field only) - enabled when a Scheduled Task type object (Survey or Repair type object) is selected in the Object Type field on the Settings Page, and Date/Time Planned is selected in the Field Name field. When this option is selected, if the object is a repeated task, planned activity will be included in calculating values in addition to completed tasks.
Series
This section allows the number and order of traces on the graph to be edited.
- Add - adds a trace below existing traces
- Delete - click on a series name and click the Delete button to remove the series
- Move Up / Move Down - click on a series name and use the Move Up and Move Down buttons to adjust the order of the traces. Traces lower down the list will be drawn on top of traces further up the list.
Y Values for Currently Selected Series
This section is used to determine which values are to be plotted along the y-axis. The options chosen apply to the series that is currently selected in the Series section.
- Series Name - optionally assign a name to the series. If this is left blank a series name will be generated automatically
- Group Values - checking this option allows values within equally spaced intervals along the x-axis to be grouped together. A single value is plotted for the group. The remaining options displayed depends on the status of this check box.
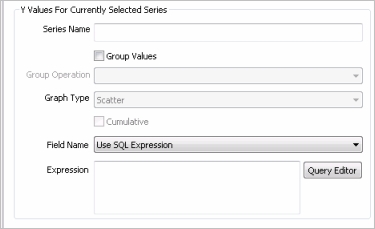
Values Not Grouped
If the Group Values option is unchecked, the following options are enabled:
Show me

- Graph Type - if values are not grouped the type of graph displayed is a scatter graph. This field is disabled and set to Scatter.
- Field Name - select the field to be plotted on the y-axis of the graph. The dropdown list contains fields applicable to the object type selected in the Object Type field on the Settings Page. Alternatively, choose the Use SQL Expression option to calculate Y values from object fields.
- Expression - displayed when the Use SQL Expression option is chosen from the Field Name field. Enter an SQL expression to calculate the Y values that are to be plotted on the graph. Click the Query Editor button to display the Query Editor Dialog to aid in building and testing the expression.
Values Grouped
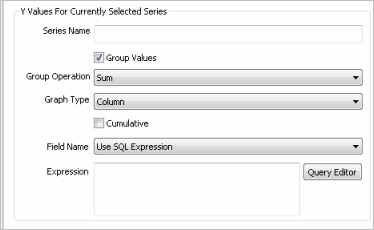
If the Group Values option is checked, the following options are enabled:
Show me

-
Group Operation - defines
the operation to be performed on the values within a group. The options
are:
- Count - count of objects in group based on X values
- Sum - totals the Y values in the group
- Average - averages the Y values in the group
- Min - minimum value of all Y values in the group
- Max - maximum value of all Y values in the group
- Graph Type - trace can be displayed as either a scatter graph or a column graph.
- Cumulative - if this option is selected, the cumulative total of Y values is plotted along the x-axis.
- Field Name - select the field to be plotted on the y-axis of the graph. The dropdown list contains fields applicable to the object type selected in the Object Type field on the Settings Page. Alternatively, choose the Use SQL Expression option to calculate Y values from object fields.
- Expression - displayed when the Use SQL Expression option is chosen from the Field Name field. Enter an SQL expression to calculate the Y values that are to be plotted on the graph. Click the Query Editor button to display the Query Editor Dialog to aid in building and testing the expression.
Group Interval
This section is displayed when the Group Values option is checked.
Show me

- Group Interval - displayed if Field Name is set to a numerical or a date field. Defines the interval over which values are to be grouped.
- Unit for X-Values which are times - displayed if Field Name is set to a date field or Use SQL Expression. Defines the time unit of the specified Group Interval.