Chapter 15: Using Planes to Understand Results
Previous: Exercise 7 | Next: Exercise 8
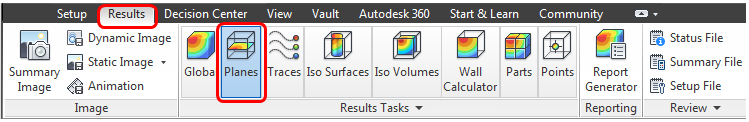
Results Planes are the primary tool for visualizing data on three dimensional models. They are cutting planes, and have several roles in Autodesk® CFD results visualization:
This chapter focuses on the following topics:
- Creating and managing planes
- Positioning and controlling the appearance of planes
- Measuring and plotting data on a plane
- Using a plane to measure bulk values
Creating and Managing Planes
Results Plane Workflow
To Create a Plane
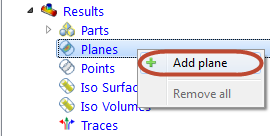
On-model: Right click on or near the model (not on an existing Plane). Click Add plane.
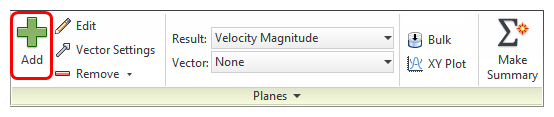
Off-model: Click Add in the Planes context panel. Alternatively, right click on the Planes branch of the Design Study bar, and click Add plane:
To Rename a Plane
- Right click on the plane ID in the Design Study bar, and click Rename.
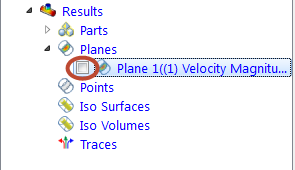
To Select a Plane
- On-model: Left click directly on the Plane.
- Off-model: Select its name from the Design Study bar.
To Disable Highlighting of the Active Plane
- Uncheck Show Outlines in the Planes context drop-down menu.
To Hide a Plane
Uncheck the visibility box adjacent to the ID in the Design Study bar:
To Delete a Plane
- On-model: Right click on the plane, and click Remove.
- Off-model: Right click on the plane ID in the Design Study bar, and click Remove.
Positioning and Controlling Plane Appearance
Plane Controls
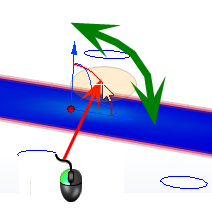
To Move a Plane
On-model: Left click on the axis on the triad, and drag to the desired location.
Off-model: Click Edit on the Planes context panel. Drag the Move slider bar on the Plane Control dialog.
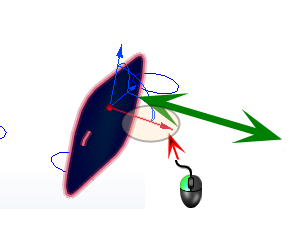
To Rotate a Plane
On-model: Drag the arc on the triad:
(To change the center of rotation, drag the triad within the Plane. The center of rotation is the triad origin.)
On-plane: Left click. Select an axis to align the Plane to:
Off-model: Click Edit on the Planes context panel. Drag the Rotate slider bar on the Plane Control dialog.
To Align to a Model Surface
On-plane: Left click, and click the Align to surface button.
Alternative On-plane: Right click, and click Align to surface.
After invoking the Align to surface command, click the desired surface in the model. The plane moves to the selected surface, and is parallel to it. If the selected surface is not planar, the plane moves to the element face closest to the selection point on the surface.
To Change the Appearance
On-plane: Right click. Select an option.
Off-model: Click Edit on the Planes context panel. Select from the Appearance menu.
To Change the Displayed Result Quantity
On-plane: Right click. Click Result, and select from the list.
Off-model: Select from the Result menu on the Planes context panel.
To Save Results on a Plane
- On-plane: Right click, and click Save table...
- Off-model: Click Save table... from the Controls dialog. To modify the results resolution, drag the Grid spacing slider.
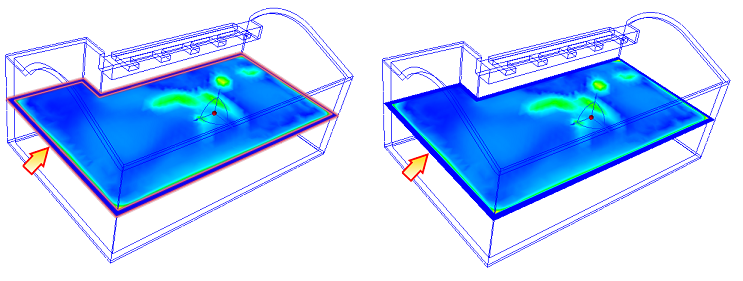
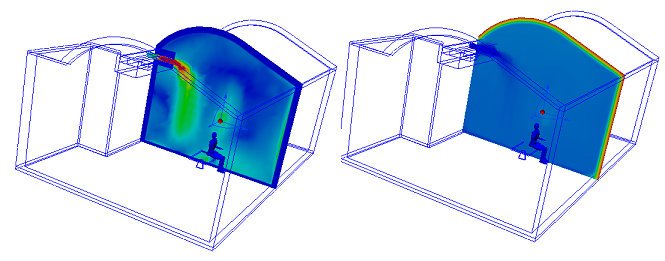
To View a Plane on a Shaded Model
Clipping improves the visibility of specific model regions, and is a powerful way to display vectors when the model is shaded.
To enable clipping, right click on the results plane and select Clip.
If the "other" side of the model is showing, right click on the plane again and choose Reverse Clip.
To disable clipping, right click on the results plane, and uncheck Clip.
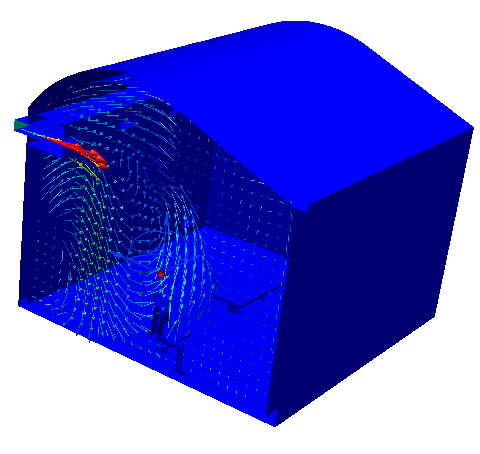
Vectors
To enable vectors or to change the vector quantity:
On-plane: Right click on the plane. Click Vector, and select the quantity.
Off-model: Select from the Vector menu on the Planes context panel.
To change vector appearance:
- On-plane: Right click on the plane. Click Vector > Settings...
- Off-model: Click the arrow adjacent to Edit on the Planes context panel, and select Vector Settings.
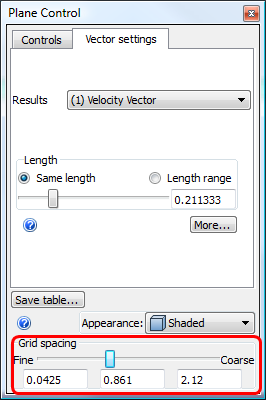
To control the vector density:
- Drag the Grid spacing slider on the Vector Settings dialog.
- To specify a finer or coarser grid spacing beyond the slider range, key in the values in the field adjacent to the slider.
Click More... to make the following changes:
To control the display of arrowheads:
- To disable arrowheads, uncheck Show arrowheads.
- To change the size of vector arrows, specify a value for the Arrowhead size. (The default size of 1 scales the arrowhead size based on the vector length.)
- To scale all vectors by the same amount, modify the value of the Scale factor.
To show regions where the active vector is within a specified range:
- Check Filtering.
- Enter a range in the Min and Max fields.
Click Reset or uncheck Filtering to display the entire model.
Plane Functionality
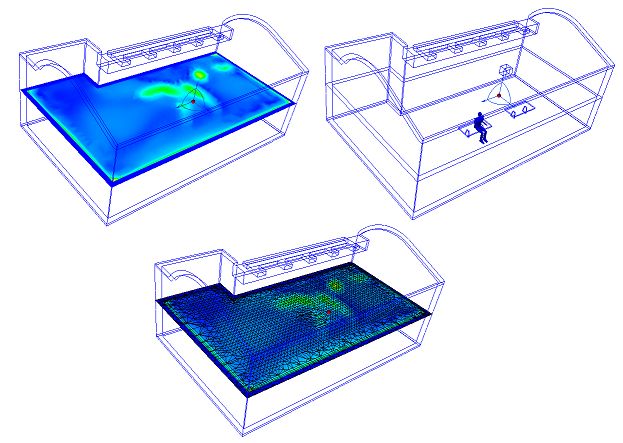
Planes provide a wide array of visualization functionality:
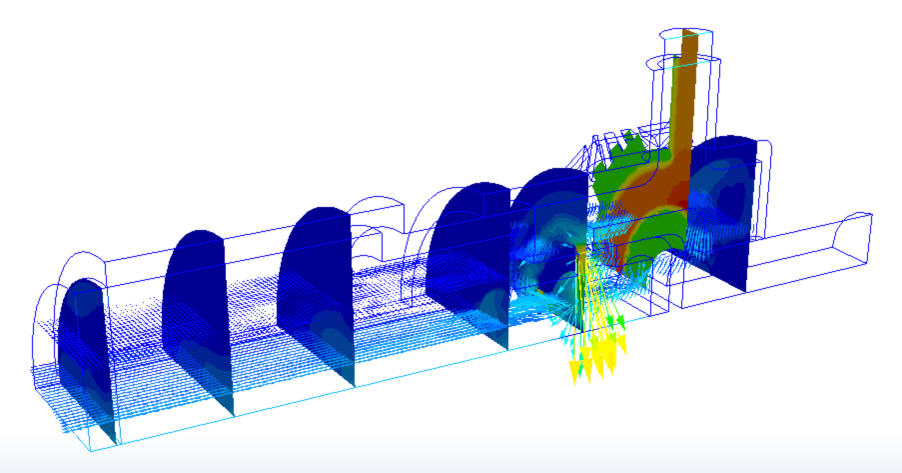
- Planes graphically present results on cross-sections.
- Planes allow extraction of bulk data through planar cross sections.
- Planes serve as a basis for XY-plots.
Accessing Plane Functionality:
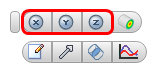
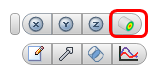
- On-model Method 1: Left click on the Plane, and click the context toolbar icon.
a. Settings (Controls) b. Vector settings c. Bulk d. XY Plot | 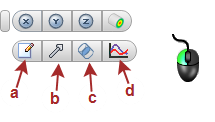 |
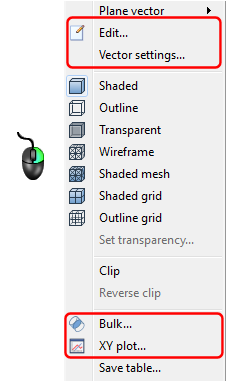
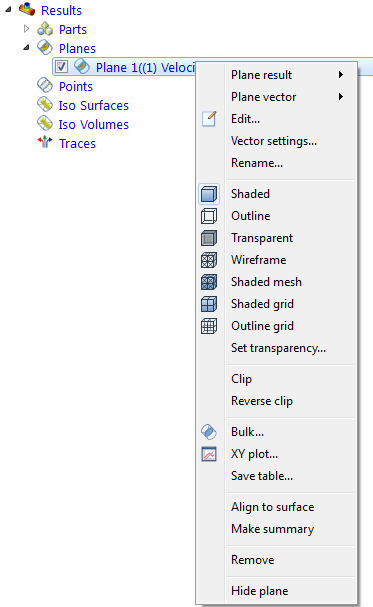
On-model Method 2: Right click on the Plane, and select from the menu.
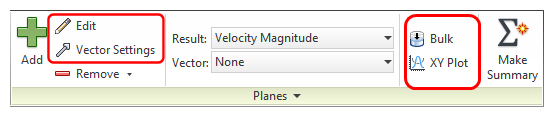
Off-model: Click the icon in the Planes context panel.
Off-model Method 2: Right click on the Plane from the Planes branch of the Design Study bar.
Measuring and Plotting Data on a Plane:
In addition to visual feedback of the flow and thermal behavior, the results plane also provides access to quantitative results. There are three ways to measure results in real time:
Probe with the Mouse
- Hover the mouse over the desired location on the results plane.
- View results in the Status Bar in the lower left corner of the Interface.
Create XY Plots
Create an XY plot by selecting points on a cutting surface, by entering point coordinates, or with points saved from a previous plot. The maximum number of points in an xy plot is 500.
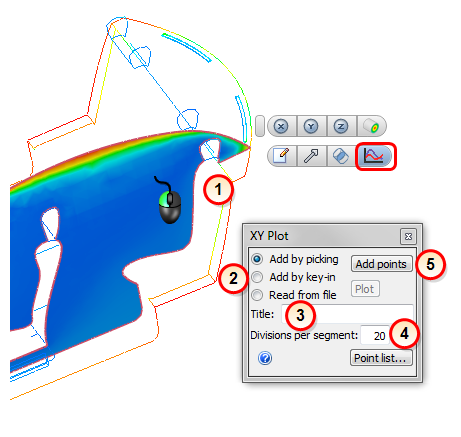
Create a Results Plane and open the XY Plot dialog.
Select the method of point selection:
Add by Picking
- Click Add points.
- Click on locations on the cutting plane through which the plot will pass. The Point List Region displays points.
- A minimum of two points is required.
Add by Key In
- Specify X, Y, and Z coordinates separated by a comma in the field. (Do not use brackets or parentheses.)
- Click Add.
Read from File
- To save XY plot point locations to a file, click Save Points.
- To create a new XY plot using saved point locations, select Read from File. Click Browse, and select the desired xyp file.
Note: You can use saved point locations to create a plot on a different scenario.
Enter a Title.
- Specify a Title for the plot. This is optional. If no title is entered, the plot is labeled "Untitled."
Change the Number of Divisions.
The default number of divisions between every point is 20.
Modify this value to change the plot resolution.
Note: The number of divisions must between 2 and 500.
Create the Plot.
- To create the plot, click Plot.
Save a table
This command saves a comma separated variable (".csv") file on a uniform distribution of points throughout the plane.
- On-plane: Right click, and click Save table...
To change the number of points saved to the table, modify the Grid spacing resolution on the Vector settings tab:
Using a Plane to Measure Bulk Values
The Bulk Calculator quickly calculates and shows bulk-weighted results on a Results Plane. Bulk (mass-weighted) results are automatically updated as the active Plane is moved.
Workflow
Start by positioning the Results Plane in the desired location.
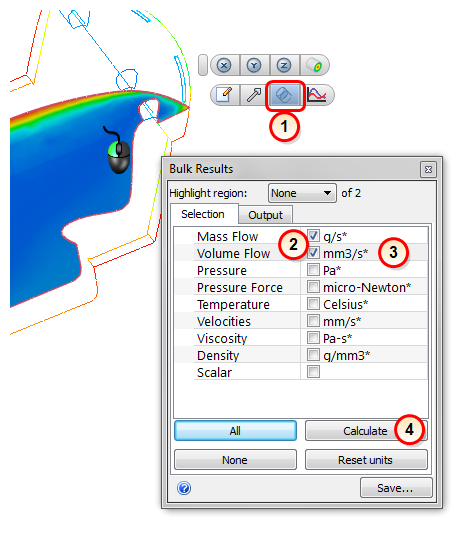
- Open the Bulk dialog.
- Select the desired quantities for bulk calculation.
- Change the units of the output quantity with the adjacent menu list.
- Click the Calculate button.
- The bulk results are written to the Output tab.
To save bulk data when animating a transient analysis, click the Save button. The results from the active time steps will be saved to an Excel csv file.
Notes
- Pressure is static gage pressure.
- Volume Flow Rate is the product of velocity and area.
- Pressure Force is the pressure integrated over an area (This is an area-weighted pressure. The pressure value produces a mass-weighted pressure value).
- Velocity components are displayed by selecting Velocities.