This topic introduces the 2D model in the sample database and shows how to simulate and analyse surface water behaviour.
You will learn how to represent flooding on a surface, configure interactions with the network, and interpret results such as depth, velocity, and hazard.
Open and explore the model
This model combines surface flow, river elements, and hydraulic structures to represent complex flooding scenarios.
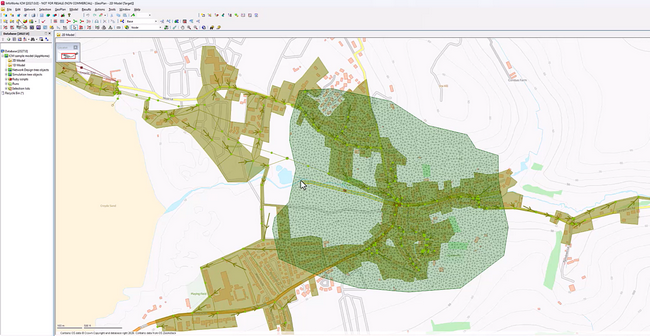
Open the 2D network from the Model group in the Explorer to display it in the GeoPlan.
The model includes:
This provides context for how surface, river, and structural elements interact within the model before running simulations.
Understand the 2D zone
The 2D zone defines the area where surface water is simulated.
- Access: Select 2D zone in GeoPlan → Properties
- Flooded water from the network is routed onto this surface
- Water movement across the zone can be analysed to identify flow paths and flood extents (see Flood extent)
Nodes must be configured correctly to exchange flow with the 2D model:
- Set node Flood type = 2D to allow interaction
- Nodes outside the 2D zone cannot be assigned this setting
Nodes must be located within the 2D zone to exchange flow with the surface. Assigning a 2D flood type outside the zone results in a validation error.
This defines where surface flooding is simulated and allows you to analyse how water spreads, accumulates, and interacts with the network.
Review river and hydraulic structures
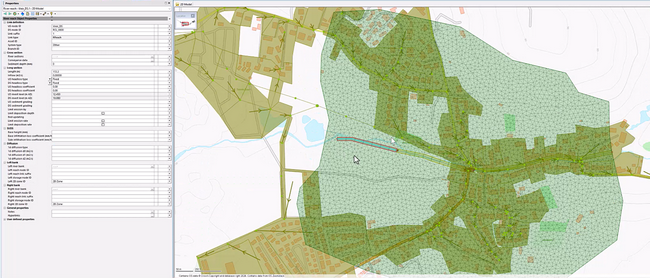
The model includes a river system and associated structures.
This allows you to represent real-world hydraulic features and assess how structures influence flow behaviour and flood risk.
River reaches
- Represent flow paths within the 2D domain
- Include cross sections and banks
- Allow identification of flooding from left or right bank
See River reaches for more information.
Structures
- Represent physical constraints within the model
- Account for head losses and flow restriction
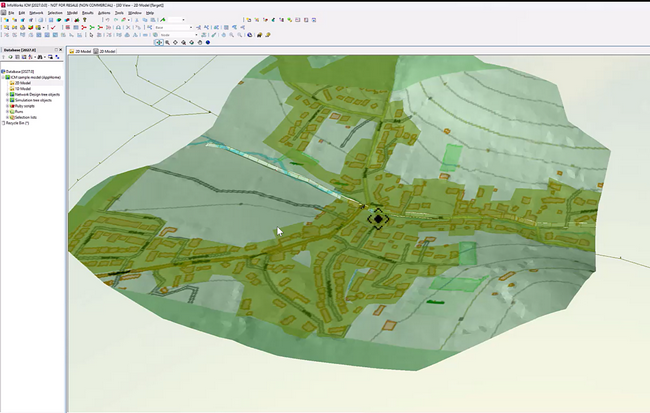
You can visualise these elements in 3D view:
- Access: GeoPlan → 3D view
- Inspect geometry and flow interaction in three dimensions
Use additional hydraulic elements
The model may include:
- Pumps - define switching levels and pumping rates
- Loops and control elements - support more complex flow behaviour
These elements support more complex modelling scenarios by allowing you to control flow behaviour dynamically within the network.
Configure inflows and water quality
The model uses external inputs to define upstream conditions and water quality.
This allows you to represent upstream conditions and track how water quality parameters move through the system during simulation.
Inflow data
- Access: Explorer → Inflow data
- Assign hydrographs to upstream nodes
- Use when the upstream system is not fully modelled
Pollutants
- Access: Explorer → Pollutant
- Define concentration inputs at selected nodes
- Analyse transport and distribution within the system
Pollutant data can be visualised after simulation to understand concentration patterns.
See Pollutants for more information
Run a 2D simulation
Simulations calculate how water moves across the surface and interacts with the network.
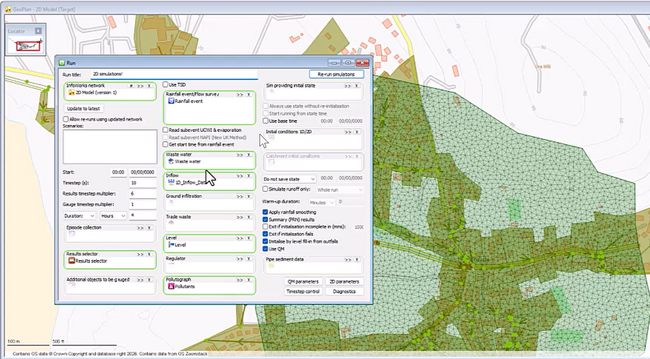
- Access: Explorer → Run Group
To run a simulation:
- Create or open a Run
- Drag required inputs into the run:
-
- Rainfall events
- Wastewater profile editor (if used)
- inflow data
- level data
- Pollutants
- Enable water quality (if required)
- Run the simulation
This enables you to simulate how water moves across the surface and interacts with the drainage network under defined conditions.
Analyse flooding behaviour
After running a simulation, you can analyse flooding behaviour to understand where water accumulates, how it flows across the surface, and which areas may be at risk.
Visualise depth and velocity
After running a simulation:
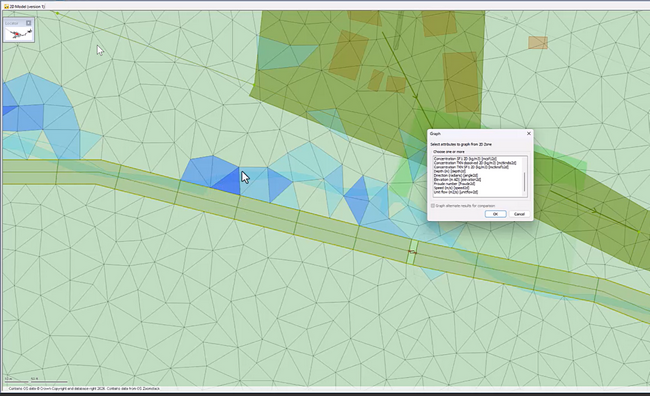
- Display depth and velocity on the 2D mesh
- Use thematic views to interpret flow patterns
2D results can be displayed as:
- depth (flood extent)
- velocity (flow speed)
- direction of flow
These can be visualised directly in the GeoPlan or in 3D view.
This helps you identify flood extent, flow paths, and areas of high velocity that may indicate potential risk.
Interpret hazard
Hazard is derived from a combination of:
- water depth
- flow velocity
Hazard combines depth and velocity to indicate areas where flood conditions may become more dangerous.
This provides a combined measure of flood severity, helping you assess where conditions may pose a greater risk to people, vehicles, or infrastructure.
Analyse pollutants
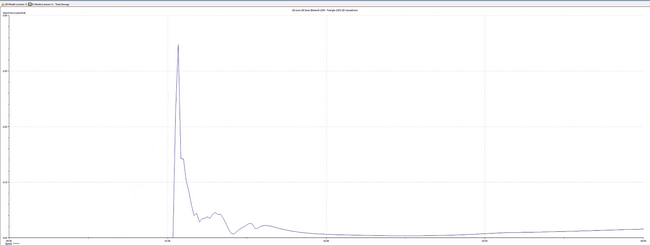
- View pollutant concentration in the model
- Understand how contaminants move through the system
This allows you to understand how contaminants are transported through the system and how they spread during flooding events.
Use result analysis tools
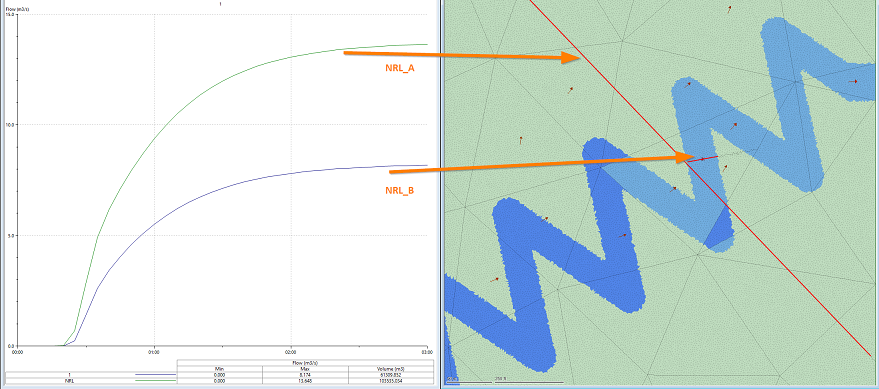
You can define custom analysis locations within the model.
Result lines
- Access: GeoPlan → create line → set as result line
- Measure flow crossing a defined line
- Values may be positive or negative depending on direction
Result polygons
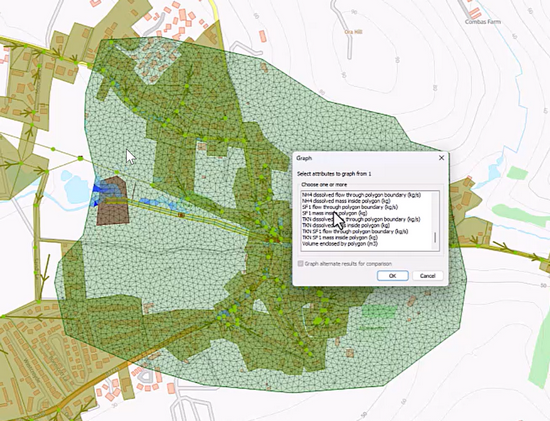
- Access: GeoPlan → create polygon → set as result polygon
- Measure:
-
- flow within an area
- total flood volume within the polygon
These tools provide measurable insights into flow distribution and flood volumes, supporting more detailed analysis of system behaviour.
Use polygons to control surface behaviour
Polygons can be used to modify how water behaves across the 2D surface.
This allows you to represent real-world surface characteristics and control how water flows across different areas of the model.
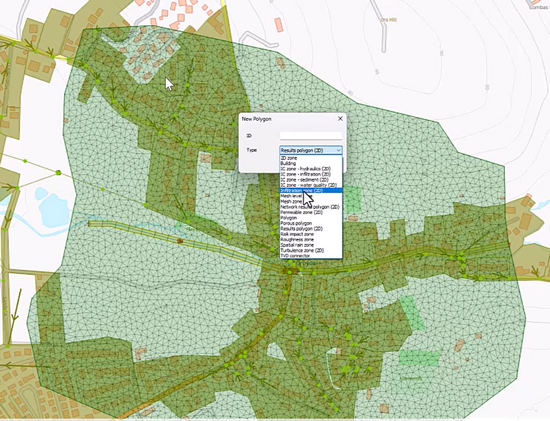
- Access: GeoPlan → draw polygon → assign type
Available polygon types include:
Roughness zones
- Represent different surface types (for example vegetation vs paved areas)
- Affect flow resistance
See Roughness zones.
Porous polygons
- Represent structures that allow partial flow (for example walls with openings)
See Porous polygons.
Mesh zones
- Control mesh resolution
- Allow finer detail in areas of interest and coarser mesh elsewhere
See Mesh zones.
Initial condition zones
- Define starting hydraulic or water quality conditions
Buildings
- Combine multiple effects (roughness, porosity, elevation) in a single object
These tools allow you to represent physical surface characteristics and refine simulation behaviour.
See Buildings.
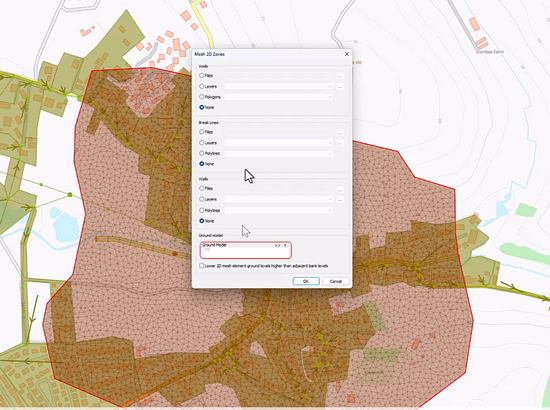
Update the mesh
Important: Any change that affects surface geometry or physics requires remeshing.
This ensures that any changes to geometry or surface behaviour are correctly reflected in the simulation results.
- Access: Select 2D zone → Model meshing → Mesh 2D zone
To update the mesh:
- Select the 2D zone.
- Assign ground model and polygon inputs.
- Generate the mesh.
- Load the mesh into the network.
You must remesh after modifying:
- Polygons
- river geometry
- surface features
Use 3D visualisation
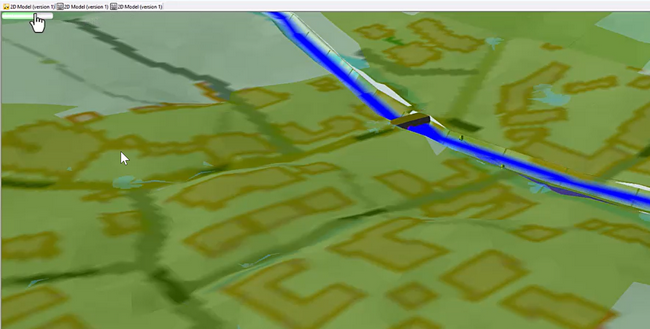
3D view provides an additional way to interpret results.
- Access: GeoPlan → 3D view
You can:
- visualise water movement across the mesh
- inspect flow through structures such as bridges
- replay simulations in 3D
This provides an intuitive way to understand flow behaviour and spatial relationships within the model.
Use cross sections
Cross sections allow you to analyse flow behaviour at specific locations.
- Access: Select cross section → plot results
You can:
- inspect water levels
- identify overtopping
- analyse flow conditions at a section
This allows you to analyse flow conditions at specific locations and identify issues such as overtopping or capacity limitations.
Additional modelling capabilities
The model may include additional elements such as Pumps, control objects, and advanced features that support more complex simulations.
Subgrid sampling can be used to improve performance for large 2D models while maintaining detail.
These capabilities extend the model to more advanced scenarios, allowing you to simulate larger or more complex systems when needed.
What you can learn from this model
This model helps you learn how to:
- represent surface flow using a 2D mesh
- configure rivers, structures, and inflows
- simulate flooding and analyse results
- use polygons to control surface behaviour
- refine simulations through mesh updates and visualisation tools