Use the Results Explorer tool to display different types of results for static analysis and gravity analysis.
Depending on the analysis type, results are presented in the form of maps and diagrams. They are displayed on elements of the analytical model for which the analysis was performed.
When an analysis is added to your project, the
Results Explorer tool
 becomes active in the
Structural Analysis panel of the
Analyze tab.
becomes active in the
Structural Analysis panel of the
Analyze tab.
- To display structural analysis results
-
- Click Analyze tab
 Structural Analysis panel Results Explorer.
The Results dialog opens.
-
At the top of the Results dialog, select the results set. The most recent results set is always on top.
-
Select the load case for which you want to explore the results.
- Click the results group you want to explore.
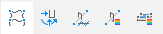 Note: There are 5 groups of results available: Deformations, Reactions, Member Forces, Member Maps, and Panel Maps, each containing a list of specific results types.
 -
Select the result type you want to explore.
The results are displayed in canvas.
Note: You can select multiple results sets simultaneously, except the maps results.
- Click Analyze tab