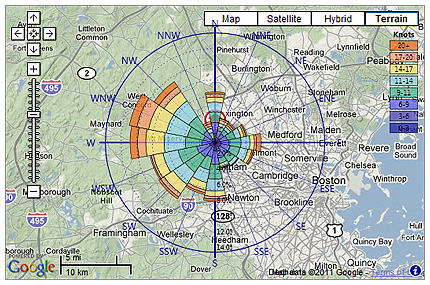
The wind rose chart shows the distribution of wind speed, wind direction and relative frequency for a given date and time range. The chart comprises 16 angular wedges, each representing an arc of 22.5° around the entire circle. The overall radius of each wedge represents the percentage of time that the wind came from that direction during the calculation period.
Each wedge contains 8 different colored segments. The color of each segment represents the speed of the wind when it was coming from that direction, as shown in the legend immediately to the right of the chart. The radius of each colored segment (and therefore its size) shows the relative percentage of time that the wind from that direction was within that speed range.
Weather Data
The chart is generated from hourly weather data retrieved from the weather station you selected for your project, or the closest weather station to the project location if you have not yet selected a specific station. This data is downloaded automatically and, depending on internet traffic, may incurr a short delay.
The Chart Display
By default, the chart is shown overlayed on an interactive Google Map centered on the location of your project's site. For more details on interacting with this map, and for important information about weather data and map location, see Overlaying a Site Map.
As an example, consider the chart shown here. This is based on weather data for Waltham, just outside Boston in the United States. In this location, it is clear that wind speeds greater than 23-29 knots are very rarely experienced. Also, the majority of winds come from the West and North-West.

Weather Data
The chart is generated from hourly weather data retrieved from the weather station you selected for your project, or the closest weather station to the project location if you have not yet selected a specific station. This data is downloaded automatically and, depending on internet traffic, may incurr a short delay.
Adjusting Chart Properties
You can adjust a range of chart properties using the slider immediately below it.

To reset the value of the slider back to the default for each property, use the reset button located just to the right of the silder

The exact property this slider will adjust can be selected from the slider properties selector, as shown below.

Opacity: This adjusts the transparency of the coloured segments within each wedge. The closer this value is to zero, the more of the underlying data beneath the wind rose chart will be visible through it. An opacity value of 1.0 means that wind rose segments will be shown in full colour with none of the underlying detail visible through.
Scale: This adjusts the maximum scale value shown in the legend. This affects the relative frequency of the wind in the different colour bands of each segment. The slider value is used as a scale factor to apply to the maximum scale value. This is useful if you want to see more or less detail at the upper and lower ends of the frequency scale.
Size: This adjusts the size of the chart relative to the underlying map or your project geometry. It effectively changes the radius of each wind rose segment relative to the outer boundaries of the chart.
Loading Alternate Weather Data

Creating a Wind Rose in your BIM Project
You can create a copy of the currently displayed wind rose within your BIM project by using the Send wind rose to BIM project button. This will load a parameterized wind rose family object and adjust it using the calculated wind speed, direction and frequency data.

If you have already loaded the wind rose family into your project, it will be updated with the current wind rose data each time you press the Send wind rose to BIM project button.