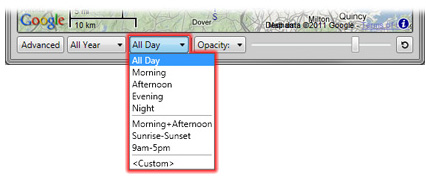
In order to achieve any real understanding of how wind conditions change throughout the year and at different times of the day, it is almost a requirement to undertake some process of interactively changing the date/time range and seeing the resulting changes within the wind rose chart.
This plugin therefore provides a wide range of methods by which you can easily select specific ranges or quickly animate over certain periods.
Basic Selection


Advanced Selection
When you select the Advanced view, an interactive annual wind speed graph is displayed. This graph shows the actual weather data being used and allows you to select ranges with more precision and flexibility than the basic selectors. For more information on what is actually shown in the graph, see Wind Speed Graph.
Using the Mouse
To change the date/time range using the mouse, you can click and drag any of the four handle on the edges of the coloured area.
You can also click and drag anywhere within the coloured area to move the whole range around. You will note that you can wrap the dates around a year, but you cannot wap times around the day. Also, the range is always contiguous - you cannot select every second month, for example.

Alternatively, by clicking and/or dragging in the annotated areas on the left and bottom of the graph, you can very quickly select by month or season as well as hour or time of day. You can also hold the Shift key down to add to a previously selected range.
Date/Time Snap Values
When dragging the range, it will always snap to the nearest increment of the values you have chosen in the date and time snap selectors.
You should set these to a value that you wish to work with. The settings you choose here is saved to the System Registry so will persist between sessions.

Entering Values Directly
To get exactly the date or time you want, you can enter the values directly in the edit boxes beneath the graph. The entered values are applied when you press the Enter key or when the edit box looses the input focus such as when you move to another control or press the Tab key.

When using the mouse wheel and the up/down buttons in these editors, the increment values are set to the current snap settings.
Incrementing the Range
You can use the six buttons on the right beneath the graph to move the date/time range in any axis or expand/contract it. You can also use the Shift and Ctrl keys to apply the changes to just one side of the range. If you hold the mouse down on these buttons, they will repeat - allowing you to animate your changes.

Using the Range Menu
In the bottom-left corner of the graph is a small button that displays a range selection menu. The items in this menu will automatically select specific regions in the graph. If you select a date range, it will leave the current time range as it is. Similarly, selecting a time range item will leave the date current range as it is. The seasonal date range items are all hemisphere-aware so the month ranges will be correctly reversed in the southern hemisphere.
