Visualisation Toolbar
The visualisation toolbar is used to change the way you view your surface. To open it, click  Visualisation Toolbar on the Optimisation Toolbar.

The themes and different views are seen in the four categories defined below.
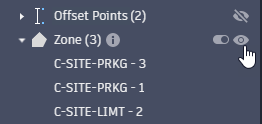
Tip: In some cases, it may be beneficial not to see the grading object in the display. You can hide objects or object types in the Grading Objects Browser. Expand the browser to the node you want to hide and place your cursor over it. Select the Visibility icon to hide it. Select it again to view it.
Result
The Result views visualise specific data for analysis. When using Result views, you will not be able to select a theme or topology. To use Themes and Topology, you will need to disable Result views by selecting  None.
None.
 Cut-Fill
The Cut-Fill view displays the surface triangles as either cut or fill in the optimisation process. This visualisation shows the degree of earthwork that will be involved. Surface triangles in a cut area are shown in red. Triangles in a fill area are shown in green. Colours darken the more the surface elevation changes. Grey triangles represent no elevation change.
The legend displays the maximum depth at the top and the minimum depth at the bottom.
 Violations
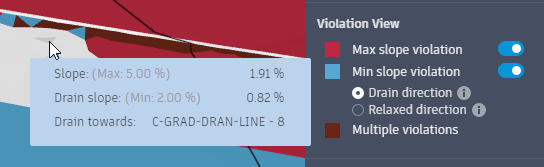
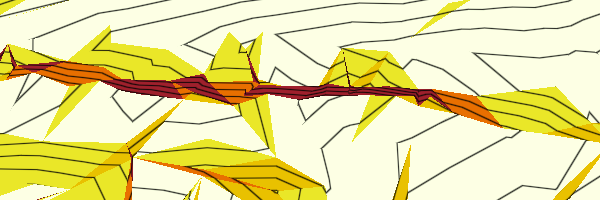
The Violation view displays triangles that are not yet optimised to meet the constraints and objectives of the project in either maroon or red. Place your cursor over a red triangle to see the violation data. For more information, see Violation Views.
The legend is not used in Violation view.
Theme
Theme displays the surface by colouring the surface triangles based on specific traits: elevation, slope or direction. Theme can use either Topology option.
 Elevation
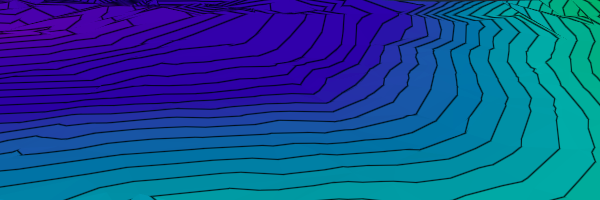
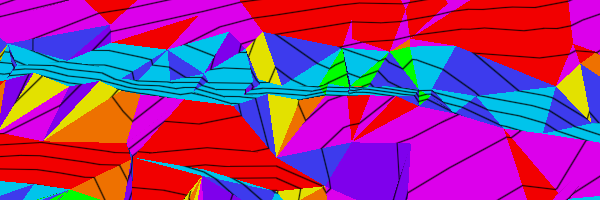
The surface triangles in an Elevation view are colour-coded by elevation. Purples represent the lowest elevation and reds represent the highest elevations.
The legend displays the colours in relation to their true elevation in Elevation view.
 Constant
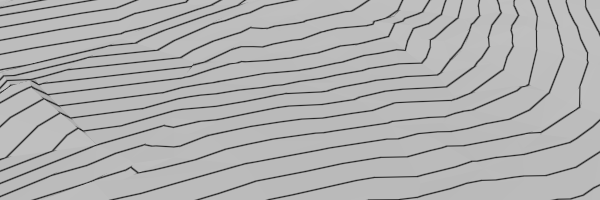
The surface triangles in a Constant view are a monotone grey, regardless of their elevation. This view is useful for viewing contour and wireframe lines during optimisation.
The legend is not used in Constant view.
 Greyscale

The surface triangles in a Greyscale view are colour-coded by elevation. Black represents the lowest elevation and white represents the highest elevations. The greys get progressively lighter as elevation increases. Greyscale is useful when the contrast in elevation is necessary.
The legend displays the elevations in relation to their representative grey in Greyscale view.
 Slope
Slope
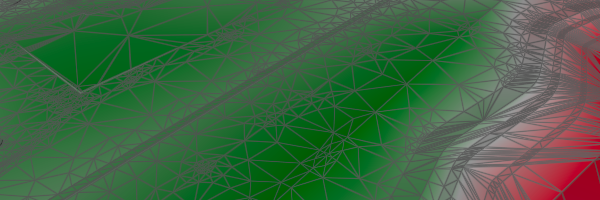
The surface triangles in a Slope view are colour-coded by the percentage of their slope.
The legend displays the slope percentage range in relation to their colour in Slope view. You can change the number of ranges, their percentage weights and colours in the Visualisation Settings dialog.
 Aspect
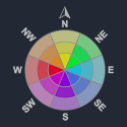
The surface triangles in an Aspect view are colour-coded by the direction of their slope.
The Aspect view hasn't got a bar legend. It uses a colour-coded compass rose to represent the slope direction of the surface triangles where north is yellow, east is blue, south is purple and west is red. Colours blend evenly around the compass.
Topology
Topology specifies how the surface lines should be viewed in your selected theme. Select either Contours or Wireframe.
 Contours
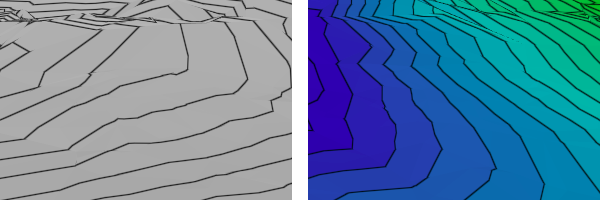
Contours mark elevation changes of the surface. They can be applied to any theme as shown in the images above. Contours have been applied to a Constant view to the left and an Elevation view to the right.
You can change the base elevation and the intervals of contours in the Visualisation Settings dialog.
 Wireframe
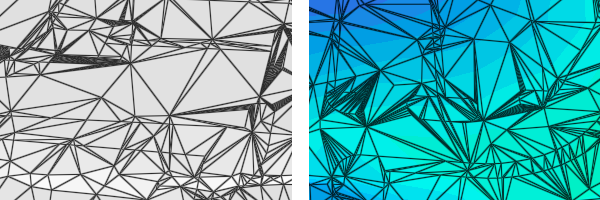
Wireframes display the surface triangles along the surface. They can be applied to any theme as shown in the images above. Wireframes have been applied to a Constant view to the left and an Elevation view to the right.
Hydrology
Hydrology applies drainage visualisation to your Result or Theme view. Disable Hydrology by selecting None.
 Direction Vectors
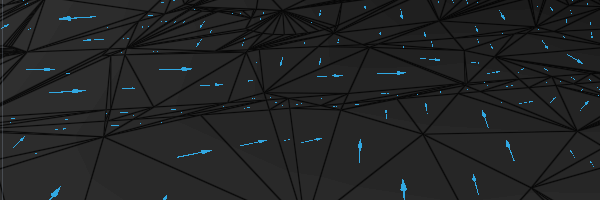
Direction Vectors overlay surface triangles with arrows showing the intended drainage direction of each triangle. The arrows are orientated towards the closest Drain Line or the closest Low Point.
The example above is shown on a greyscale theme for contrast.