Analysing the Convergence Plot and Violations
Analyse convergence plot and violation trends.
Learning Objectives
- Explore the convergence plot and violation views in analysing the feasibility of a grading project.
- Interact with the solver calculations by reducing or removing objectives.
- Learn basic strategies to relax constraints.
Set a Minimum Drain Slope
In the previous exercise Setting Objectives and Running Optimisation you discovered that the terrain did not get graded as expected. When grading a side close to a river bank, you want the overall drain pattern of the site to drain towards the river. Achieving drainage occurs by specifying the minimum drain slope constraint.
Continue where you left off with GO-Riverbank_1.dwg in Civil 3D Imperial.
In the Grading Objects Browser, select the grading limit under the Grading Limit category.

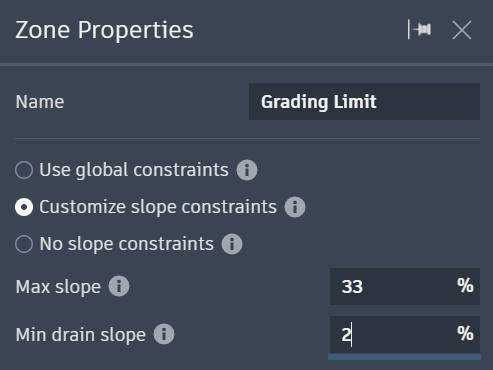
In the Grading Limit Properties panel, change the minimum drain slope to 2%.
If you run the optimisation now, you will get the exact same result as before. This may be surprising, but remember:
Minimum drainage slope in Grading Optimization requires drain elements such as drain lines or low points. The minimum drainage slope constraint cannot calculate if drain elements are missing.
Place a Drain Line
Close Grading Optimization and go back to Civil 3D.
On the surface, select the straight polyline in the river that runs from North to South.
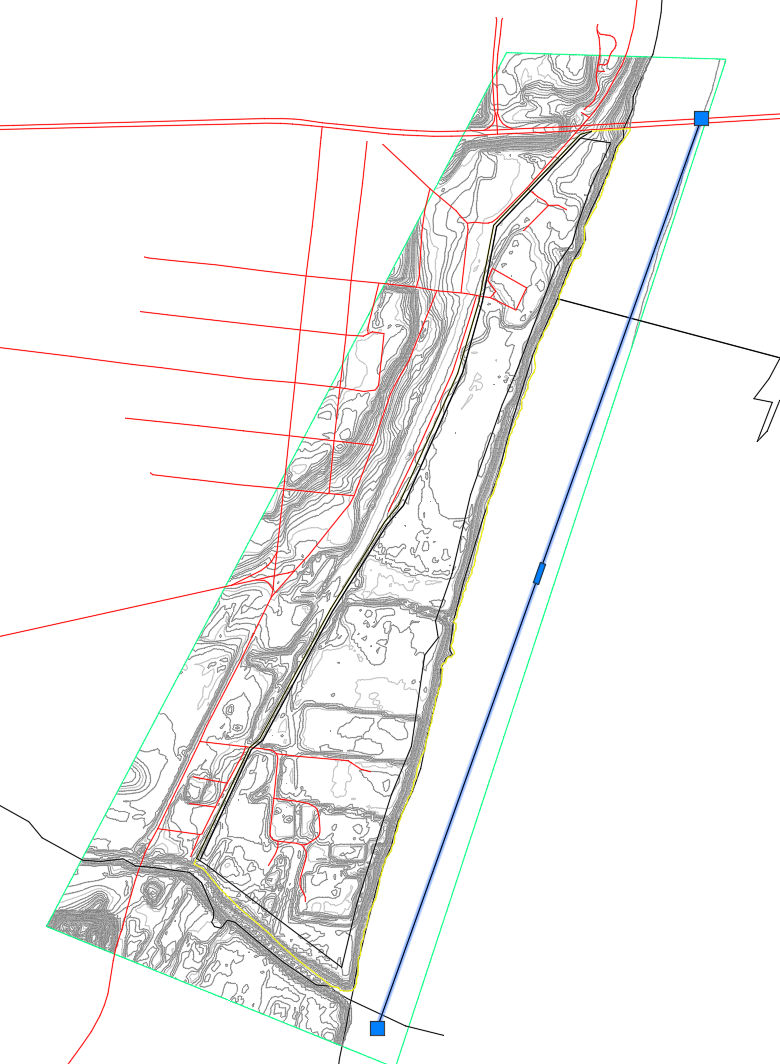
In the Grading Object Tools Palette, select
 Drain Line.
Press Enter.
This creates a drain line named Drain Line -1.
Click Analyse tab > Grading Optimisation panel >
 Optimise.
Notice in the Grading Object Browser that the drain line has been created.

Run Optimisation
Click
 Optimise to begin the optimisation.
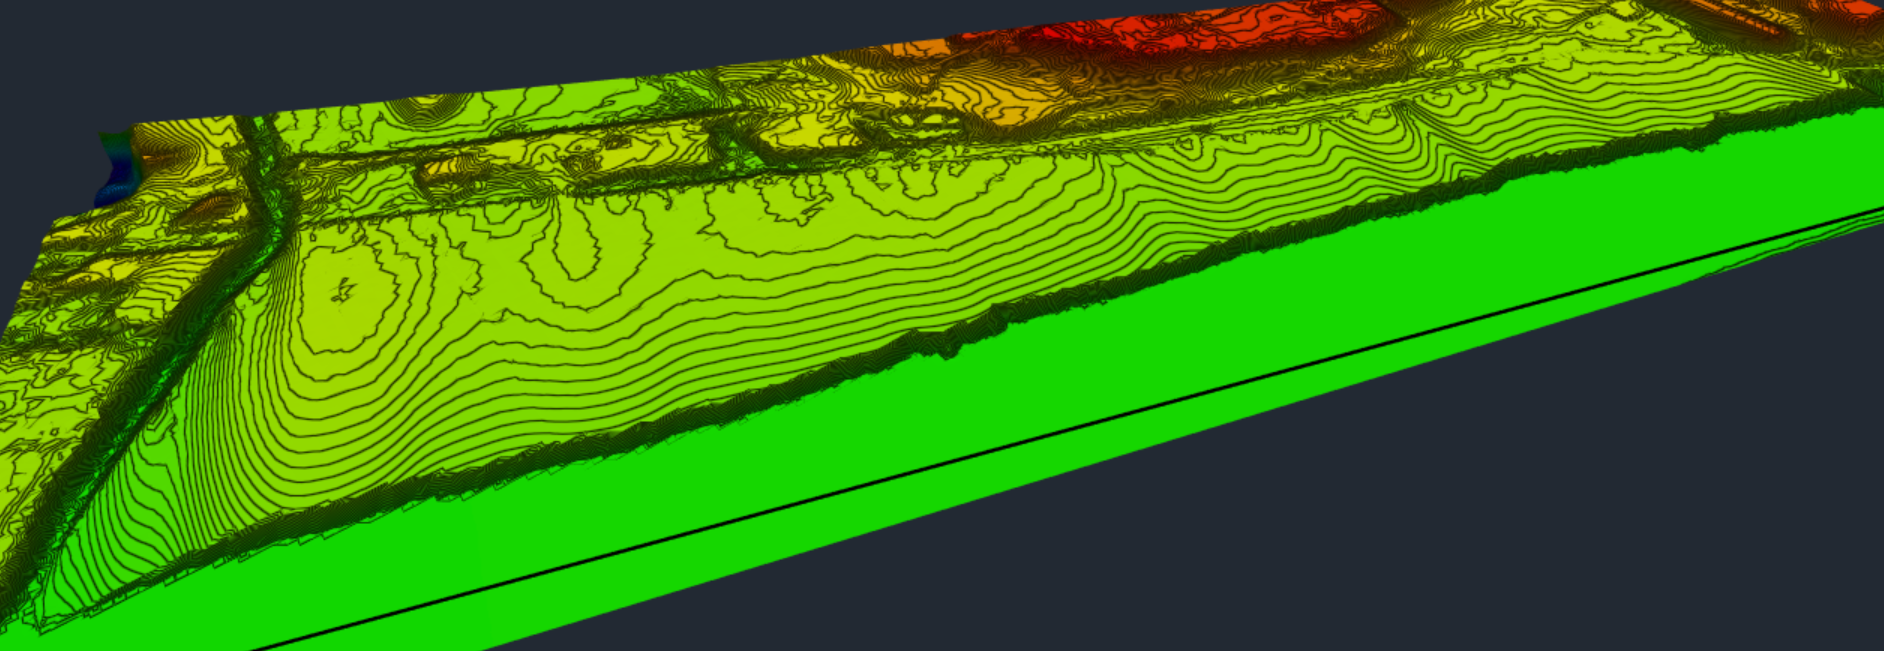
You can see the surface fills up a benching along the river and tries to slope up towards the road to allow for drainage.
Click
 on either the Violation tab or Cut/Fill tab of the Optimisation Panel to open the Convergence Plots dialog.
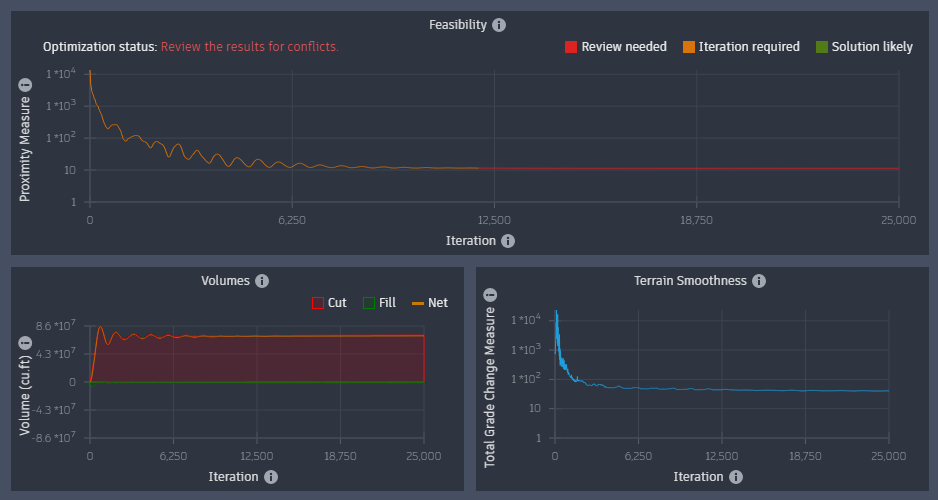
The convergence plot proximity value appears to flatten out at a very high value.

This optimisation appears not to be feasible.
Examine the Violation View
To better understand why the problem may not be feasible, you can examine surface violations that have occurred.
On the bottom right of Grading Optimization, on the Optimisation Toolbar, click
 Visualisation Toolbar.
On the Visualisation Toolbar, click
 to change to the Violation View.
You can zoom in to notice surface triangles displaying violation colours.

These colours are violation indicators specific to the surface triangles.
- Red indicates a maximum slope violation.
- Blue indicates a minimum drain slope violation.
- Maroon indicates both a maximum slope violation and minimum drain slope violation.
It may seem confusing that a triangle can have a maximum slope violation and a minimum drain slope violation at the same time.
Since the minimum drain slope is a directional slope in the direction of the closest drain element, it is a separate constraint and not a lower bound for the maximum slope constraint. Maximum Slope and Minimum Drain Slope are two different constraints.
Place your cursor over one of the many blue triangles and you can see the slope settings, as well as the actual slope values of the violated triangle.
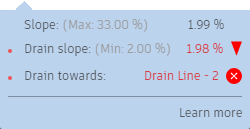
On very large areas, the triangles seem not to be able to slope towards the drain line at 2%. Interestingly, the triangles on the steep benching that was created satisfy the minimum drain slope but are also right below the maximum allowed slope. The reason why the solver sloped the terrain at 2% above the created benching is that the benching is actually part of balancing the cut an fill values. This objective has a relatively high weight and with only 25,000 iterations, the solver may still be working on improving the constraints.
On the Visualisation Toolbar, click  to change to the Cut and Fill balance view.
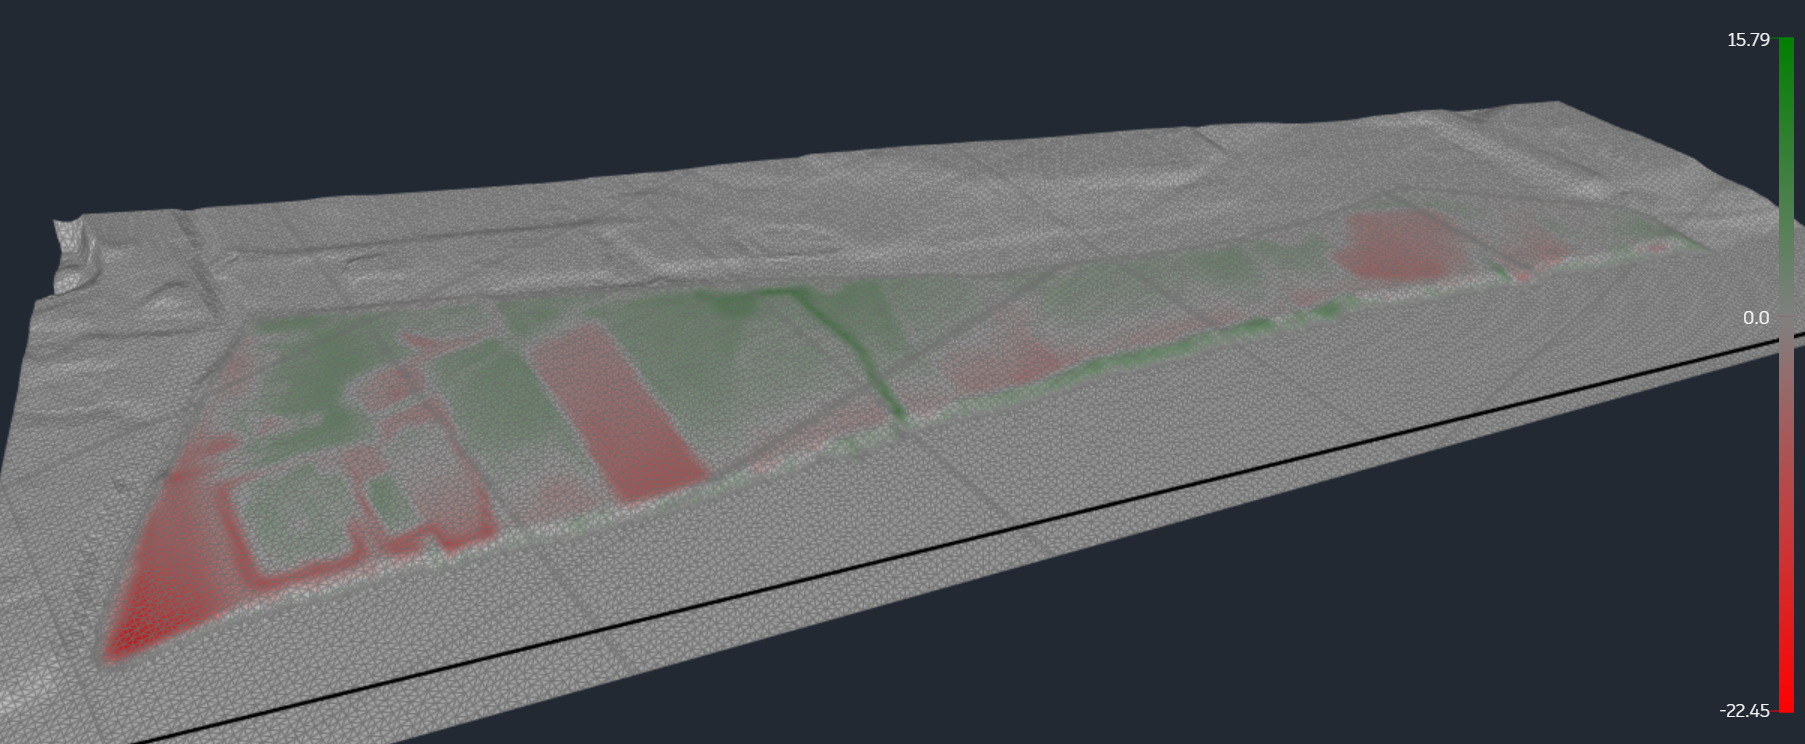
Reduce Objective Weights
The drainage slope constraint is more important in this instance than the two objective functions, so you will adjust the Optimisation Settings accordingly.
On the Optimisation Toolbar, click
 Optimisation Options.
Reduce the objective weights to 1.
Increase the iterations to 100,000, because the solver will trade off objectives for constraints when given enough time.
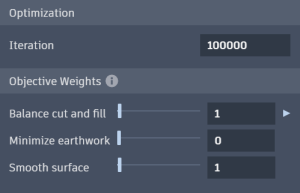
Click
 Optimise to run the optimisation again.
Click
 on either the Violation tab or Cut-fill tab of the Optimisation Panel.
The solver gets closer to a feasible solution than before. Even after 100,000 iterations, the proximity value is still decreasing and the solver is trading off the constraints for the objectives.
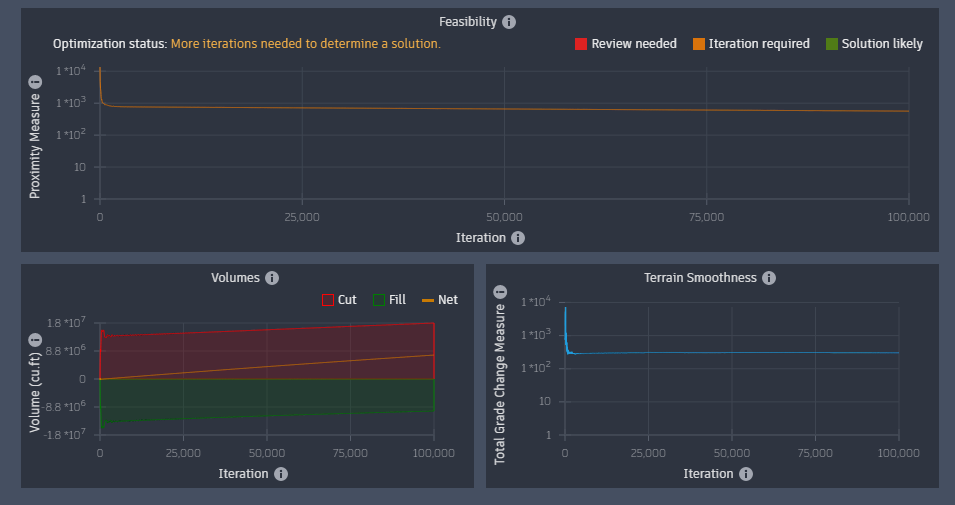
You could increase the iterations to 1,000,000 and let it run for a long time to see if the problem converges. However, turning of balancing is a faster way to check for feasibility.
Set Balance cut and fill to zero. Also leave the terrain smoothing at a very small value.
Set the iterations to 25,000.
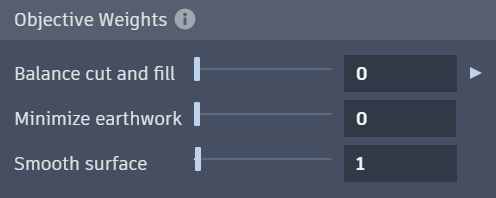
When optimised, notice that the proximity value gets closer but this time clearly flattens out at a two-digit value.
Review the surface in Violation View.
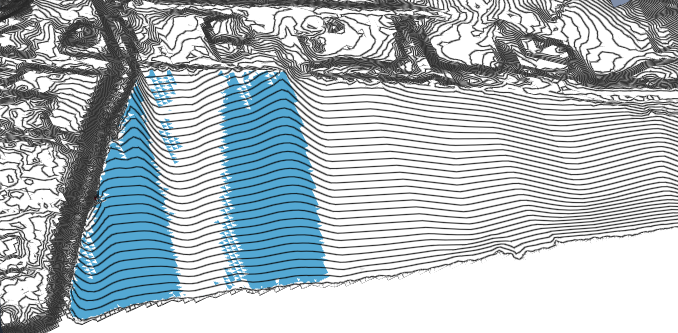
On the South side of the grading area, the solver cannot slope the triangles at the required minimum 2% towards the river.
Once again, the configuration is not feasible.
Relax Constraints
Now try relaxing the constraints of the Grading Limit.
On the Object Browser, select the Grading Limit to open the Grading Limit Properties panel.
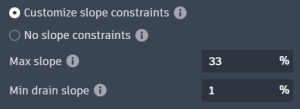
Select Customise slope constraints.
Specify the Max slope to 33%.
Specify the Min drain slope to 1%.
Click
 Optimise to run the optimisation again.
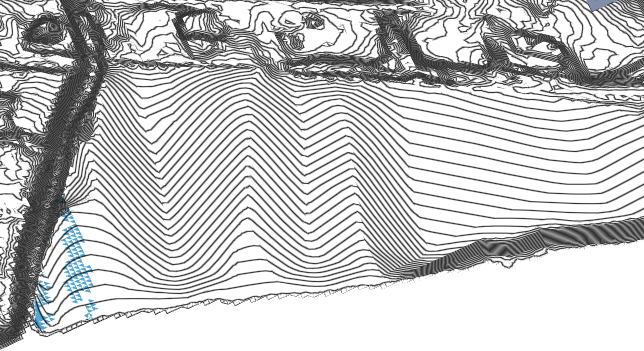
The proximity value in the feasibility plot flattens out again, but this time at a one-digit value.

This is getting closer to a feasible solution, but there are still a few triangles on the very South corner to the river that cannot slope at the required 1% towards the drain line in the river. Checking the Violation View shows this.
Looking back at the unoptimised source drawing in Civil 3D, you could place an elevation spot label at the plot boundary by the road and another one at the riverside. Measuring the distances, you can calculate that the slope between road and river is approximately 1.79%.
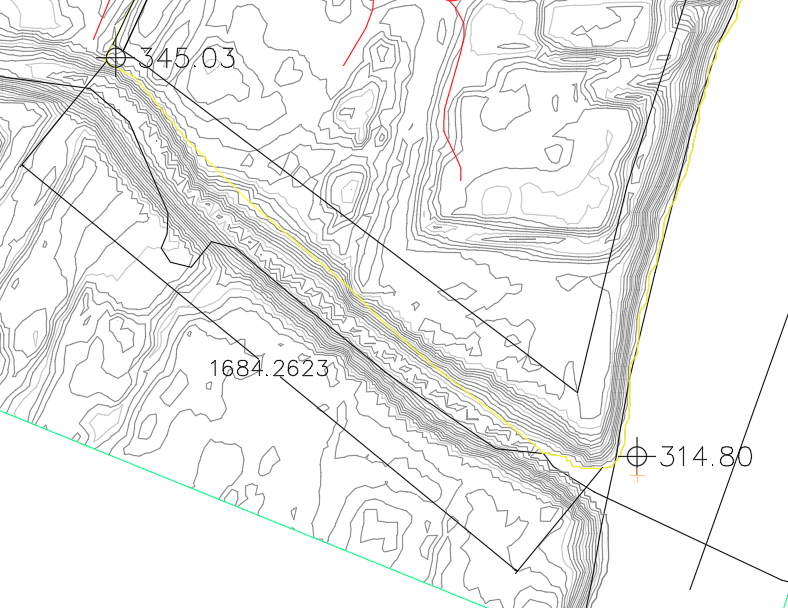
It should be feasible to grade it to 1%. Why can the solver not solve it? The reason is the nearby grading limit.
If you cut the section of the yellow grading limit line between the two surface spot elevations, make it a feature line and create a quick profile from it, you can see the current slope.
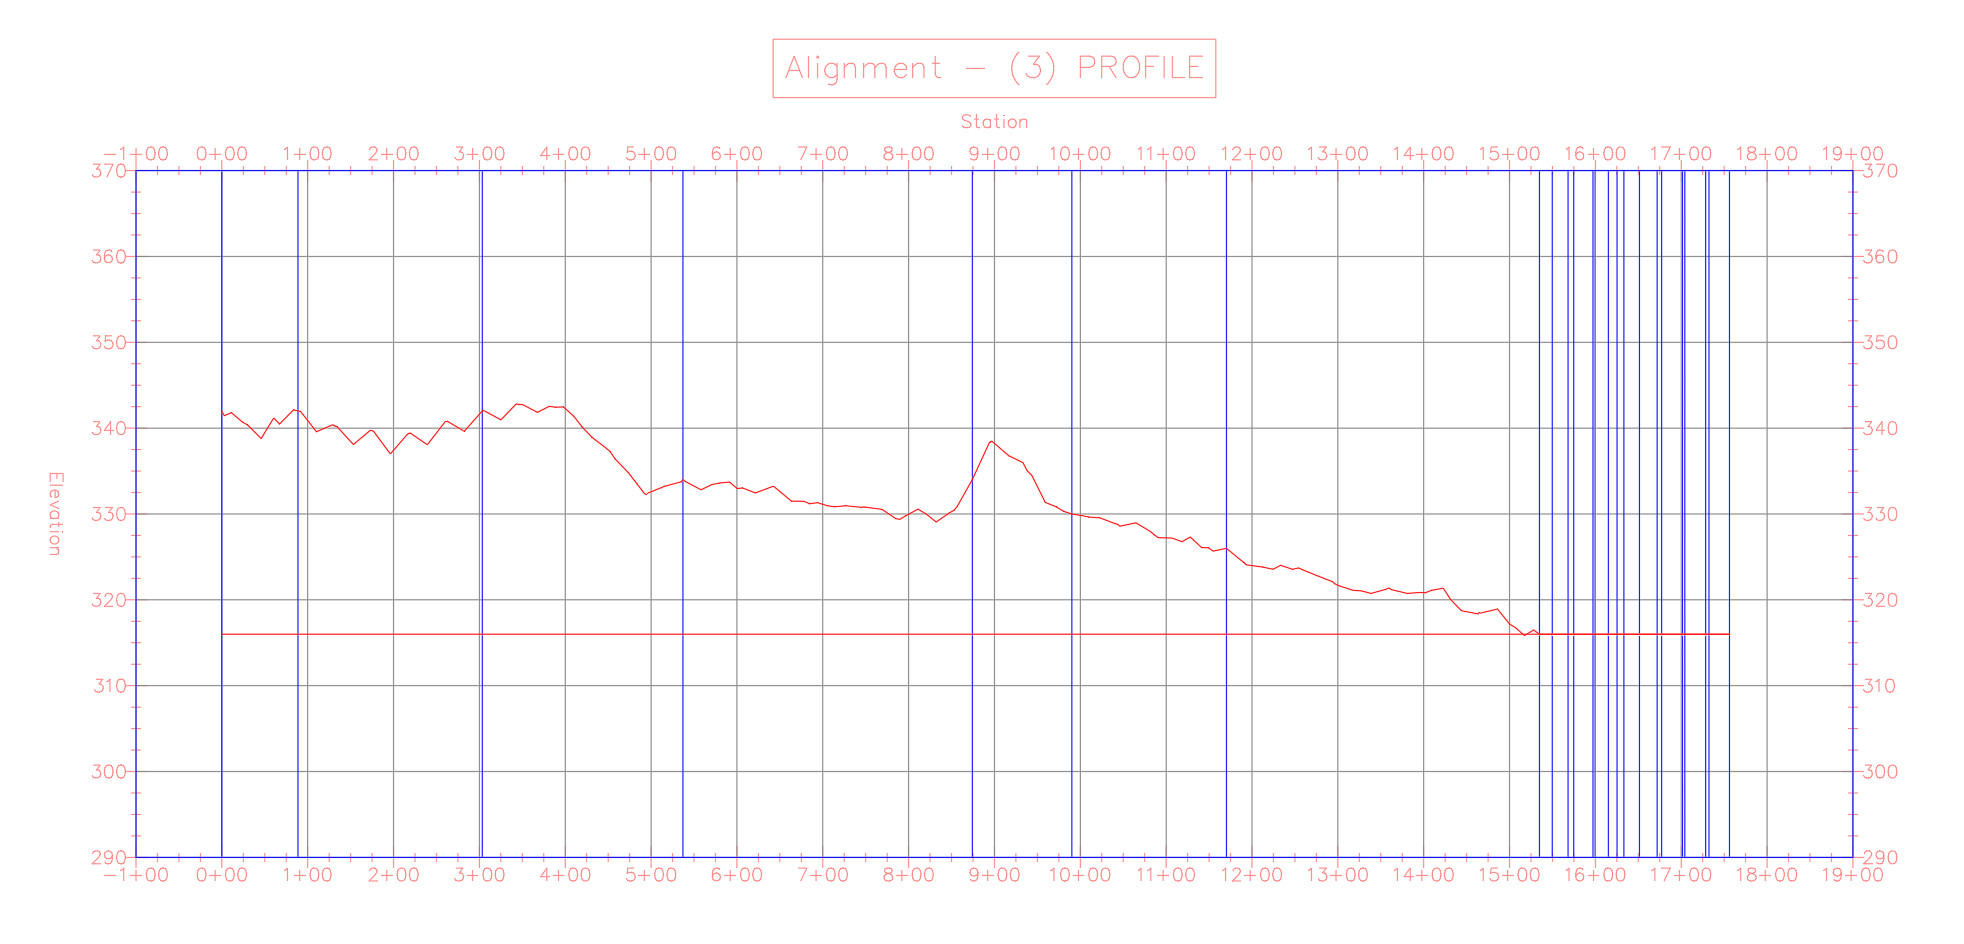
Remember, the points on the boundary of a Grading Limit will be fixed to the existing ground elevation.
Also note that the minimum drain slope constraint requires triangles to incline themselves towards the river at 1%. Looking at the profile again, you can see the yellow marked areas in the following profile view make it impossible to satisfy the minimum drain slope.
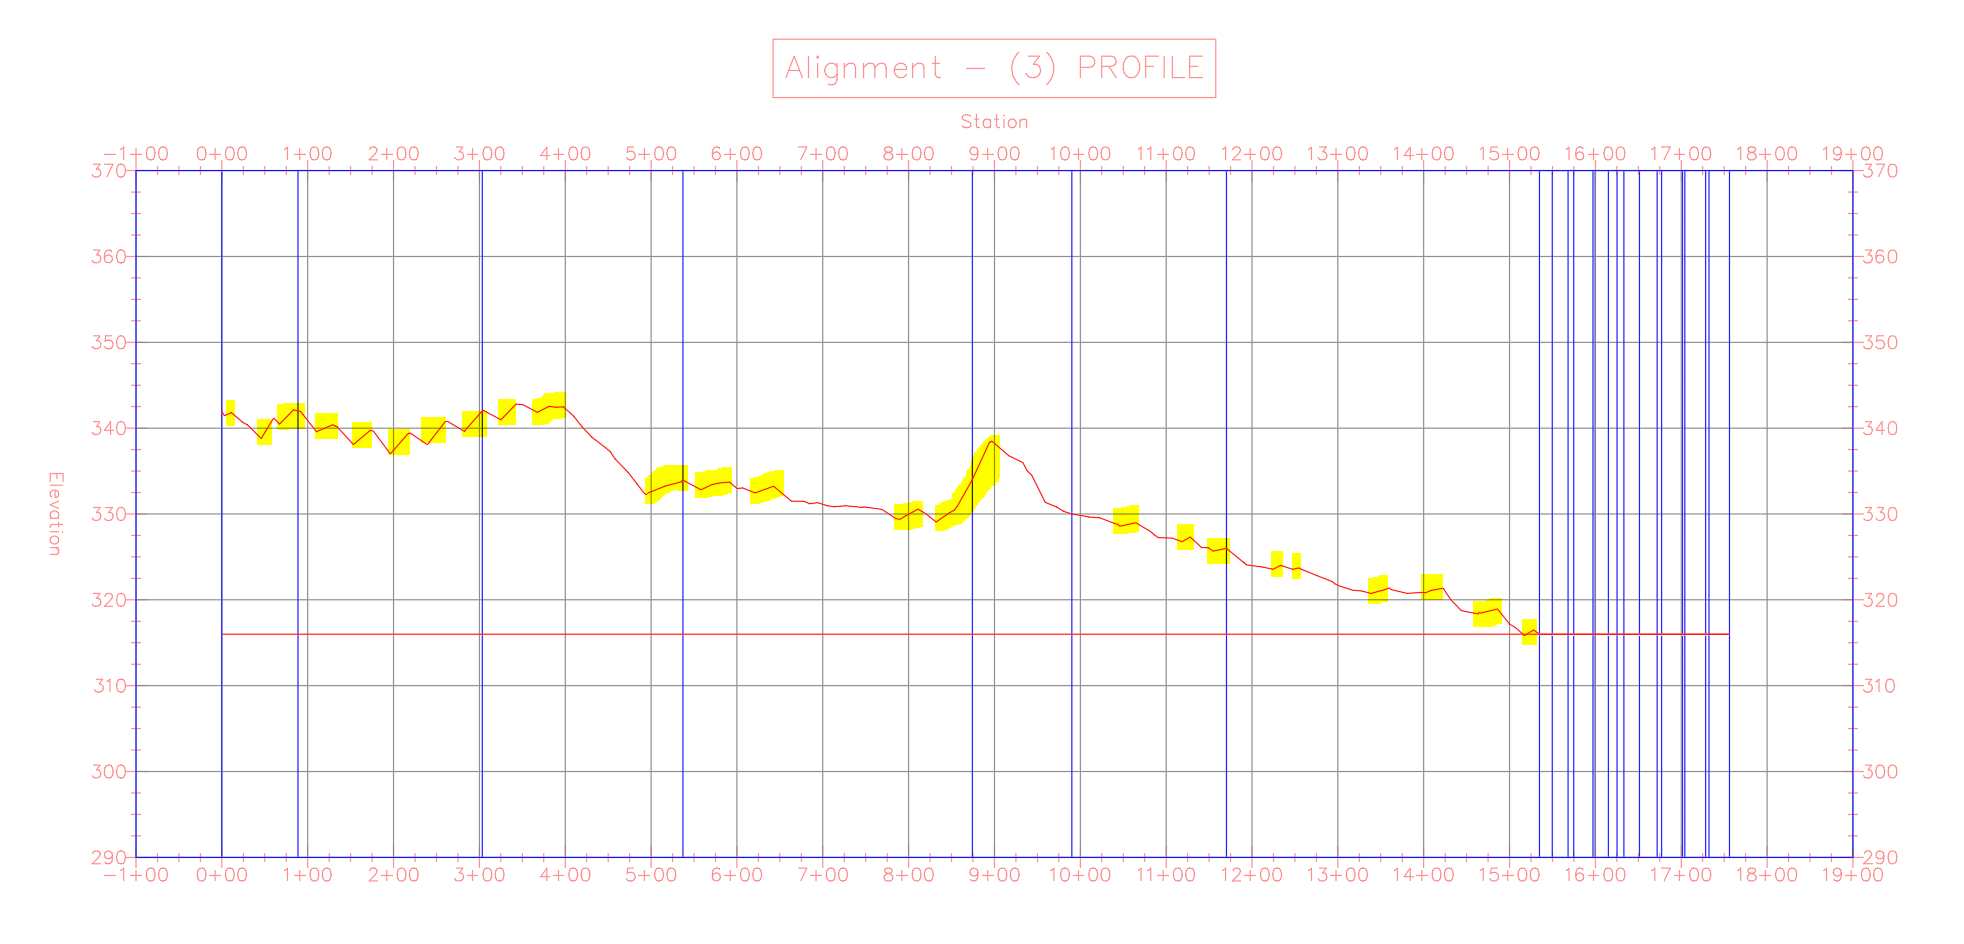
This configuration is not feasible in its current state. You will need to further relax the constraints for this problem.