Connections – Item Results shows a summary of how the selected Connection performed for the current storm/event as highlighted on the Storm Selector.
Graphs
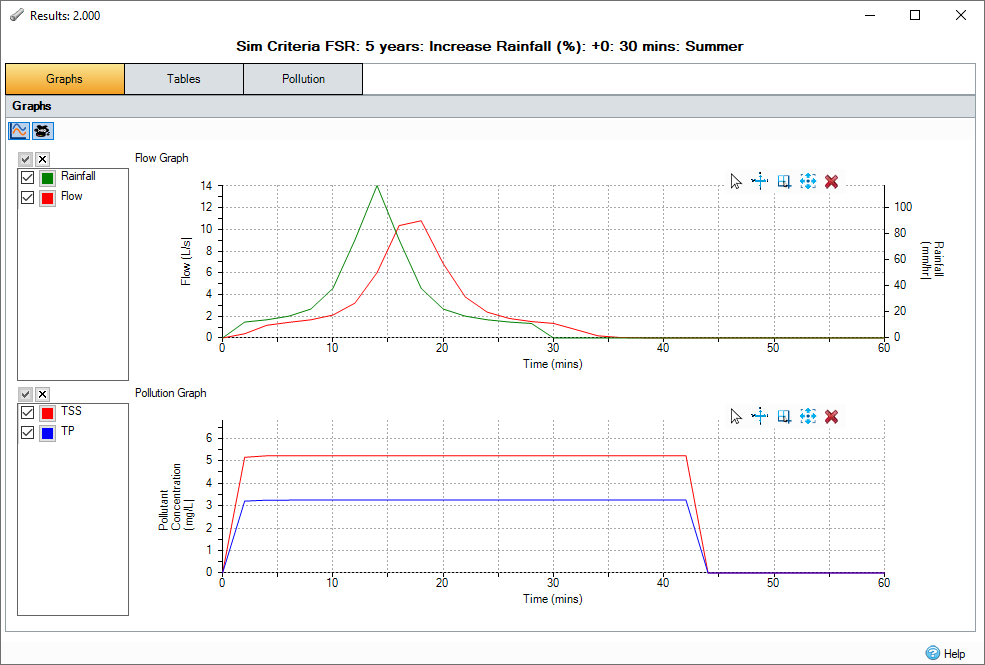
Provides graphs showing different aspects of the result, each of which can be turned on and off as required. For more information, see the Graph Tools and Results Graphs pages.
 Flows – Provides a graph showing the flow into/from the Inlet against time.
For phases containing only Baseflow or Input Hydrographs, rainfall will not be available.
 Pollution – Shows the Pollutant concentrations passing through the Inlet against time.
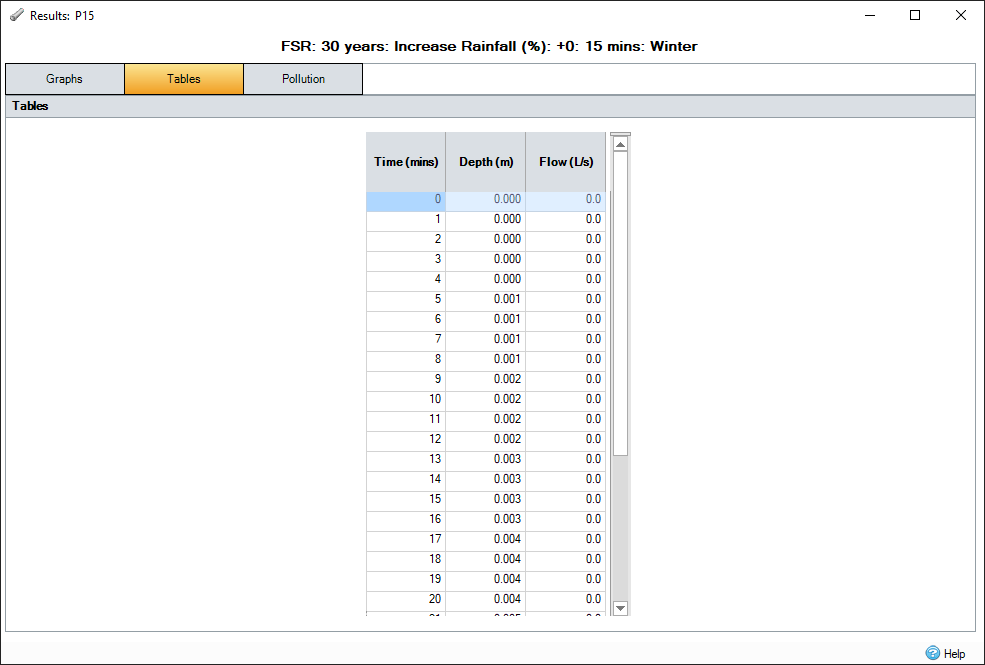
Results
Shows the minute-by-minute flow data from the analysis of the connection.
The information is shown to a default number of decimal places, based on the unit. If you want to see more or less decimal places, you can select Increment Decimal or Decrement Decimal from the right-click menu. This setting will not be saved between sessions.
Output Interval
The output interval comes from the value selected in the Analysis Criteria. The results are averaged over the output interval period. For example, if the Output Interval is 5 minutes and the Analysis Interval is 1 minute, the results calculated for the 1–5-minute intervals are averaged to produce the 5-minute result.
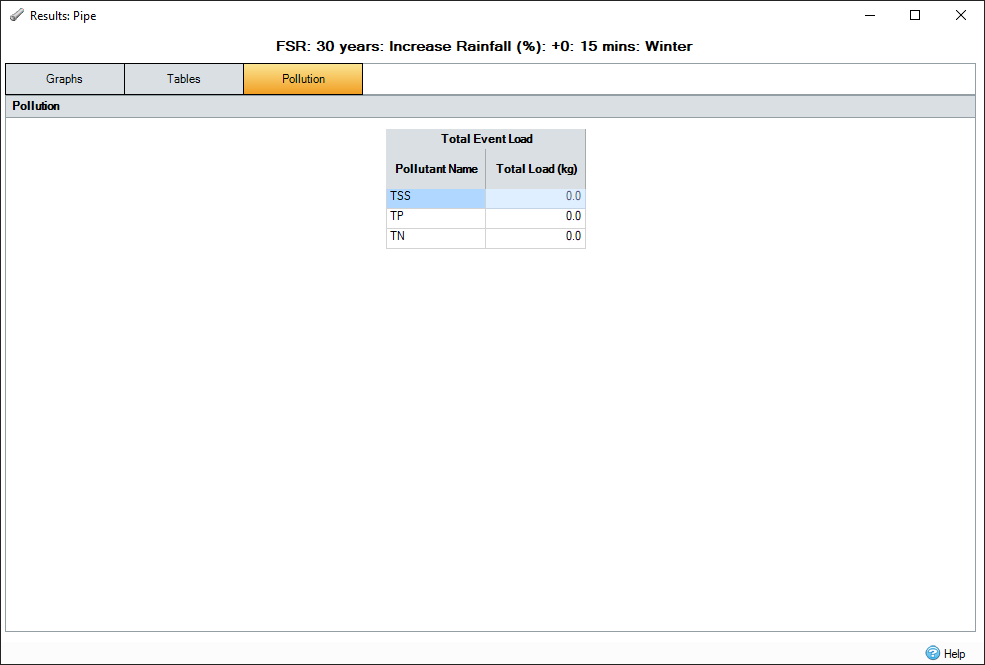
Pollution
Provides a breakdown of the Pollutant loads passing through the connection.