Insight
Working on a construction project can involve hundreds of subcontractors, thousands of issues, and a daily changing environment. Insight is an ecosystem that delivers unified project-level data, analytics, and predictive insights. It can help get you up to speed with what's going on in a project, assess trends and patterns in project data, identify any gaps and problems, and use predictive risk data to improve project efficiency.
Navigate between the tabs to view different areas of Insight and then use the cards on each tab to review project data.
Data Source
If your project has both Classic Field and Field Management active, you can toggle the Construction IQ data sources displayed in cards.
Click

Click Data Source.
Select either Field management or BIM 360 Field (classic).
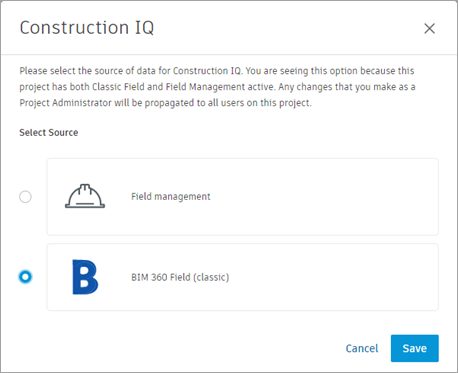
Click Save.
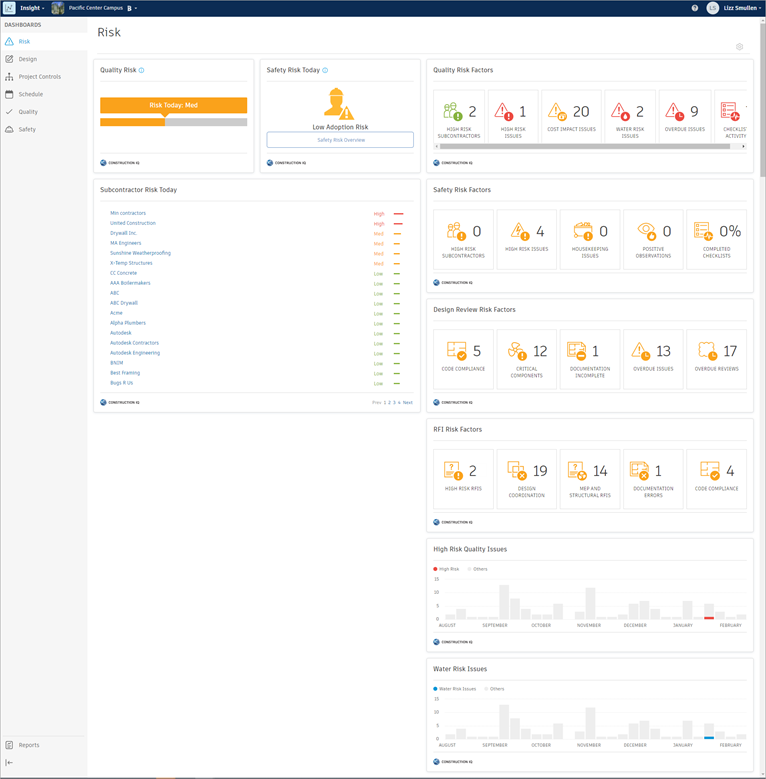
Risk Tab
Use the Risk tab to get an overview of metrics related to the current high-risk issues in your project.
The Risk tab aggregates your project risk data into one view, allowing you to monitor quality and safety risk, the number and type of high risk issues such as water risks, and the subcontractors with the highest daily risk.
To edit the cards displayed on the Risk tab, click Customize at the top-right. You can drag the cards to reorder them, click ![]()
 Hide card to remove a card, or use the Card Library to search for and add more cards.
Design Tab
Use the Design tab to get an overview of metrics related to design review and model coordination processes.
The Design tab provides insights into trends and patterns around outstanding design and coordination issues and reviews, and which companies are responsible for resolving them. This can help to avoid costly RFIs and late-stage issue resolution stemming from design problems. Use features such as issues, markups, and reviews in Document Management, in conjunction with the Design cards in Insight to improve the design review process. The design analytics cards are available in the card library and can be added to any other BIM 360 dashboards.
See the Analyze Design Review Risk topic for more information on how the cards within the Design tab can be used to predict and prevent design issues as part of a design review.
Project Controls Tab
Use the Project Controls tab to get an overview of metrics related to the issues, RFIs, and submittals associated with your project.
The Project Controls tab aggregates your project data into one view, allowing you to monitor and manage your project workflows at a high-level.
To edit the cards displayed on the Project Controls tab, click Customize at the top-right. You can drag the cards to reorder them, click ![]() Hide card to remove a card, or use the Card Library to search for and add more cards.
Hide card to remove a card, or use the Card Library to search for and add more cards.
Cost Tab
Use the Cost tab to get an overview of cost and budget trends, such as the original vs projected budget for different aspects of your project.
Schedule Tab
The Schedule tab provides a centralized view for relevant project scheduling data. This includes the percent plan completed snapshot, an activity Gantt view, the activity root cause, and the weekly activity totals. The centralized view of this data can help you view, manage, and take action on potential schedule risks.
Quality Tab
Use the Quality tab to get an overview of metrics related to the quality of your project.
The Quality tab aggregates your project quality data into one view, allowing you to monitor issue status, activity, and root cause.
Safety Tab
Use the Safety tab to get an overview of metrics related to the safety and risk of your project.
The Safety tab aggregates your project safety and risk data into one view, allowing you to monitor safety issue status, safety observations, safety risk and the subcontractors with the highest daily safety risk.
Reports Tab
Use the Reports tab to get a quick overview of the reports exported in various BIM 360 modules, such as Document Management, Field Management, and Project Management. Gain insight into data related to issues, checklists, documents, submittals, and RFIs. Project administrators can also create reports using pre-defined custom templates. To learn more, see Reports in Insight.