Results analysis for a part alignment
Fusion Manufacturing Extension
This feature is part of an extension. Extensions are a flexible way to access additional capabilities in Fusion. Learn more.
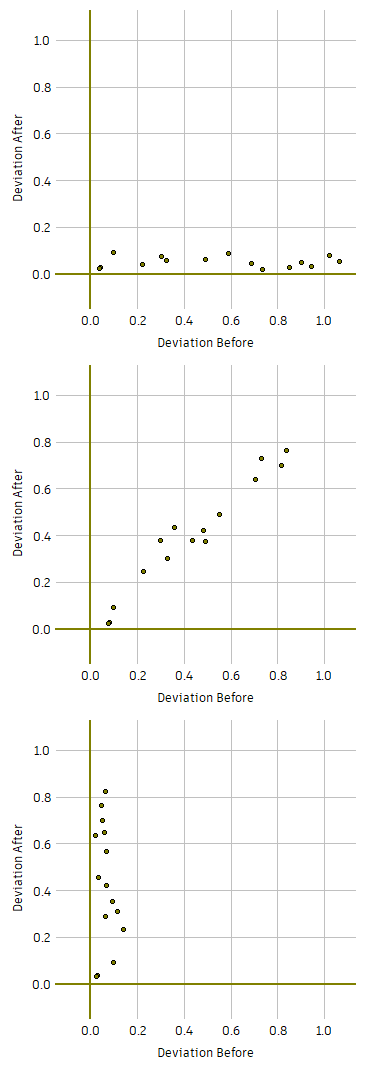
Fusion uses surface inspection results to calculate a part alignment. The graph plots the deviation of probed points before (on the horizontal axis) and after (on the vertical axis) a part alignment is applied.
A correlation can quickly indicate if the calculated part alignment has resulted in reduced deviation (top), little change (middle), or increased deviation (bottom):

Note: The graph in the Part Alignment dialog, the results in the Inspection Results window, and the colored results on the canvas are interactive. Clicking a point in one highlights it in the other two.