Activity 6: Compare the study results
In this activity, you perform a side-by-side comparison of the results of Study 1 and Study 2. The Compare tab enables you to view the results of up to four simulation studies, at the same time, in tiled windows. To compare the results of the two studies, you
- Synchronize the views, so that switching one result changes the result in the other study, simultaneously
- Compare the displacement results for the two studies
- Compare the stress results for the two studies
- Compare the safety factor results for the two studies
- Compare the contact pressure results for the two studies.
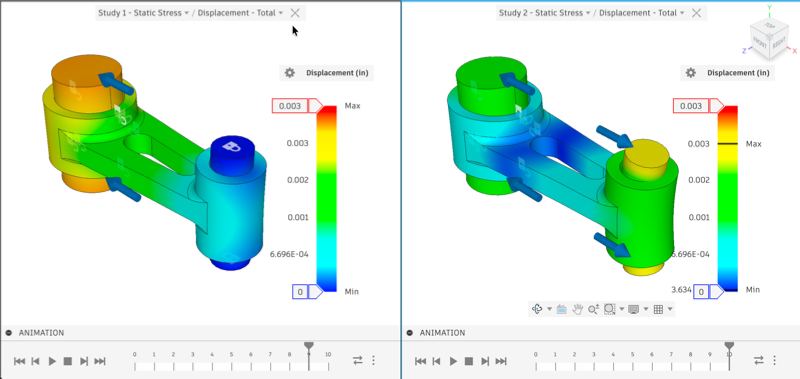
Study 1: Displacement in a statically stable model (left), and Study 2: Displacement in a partially unconstrained model (right).
Prerequisties
- Activity 5 is complete.
Steps
Access the Compare tab and select the studies to compare.
- Click
 (Simulation workspace > Results tab > Compare panel > Compare), to access the Compare dialog.
Two side-by-side contour plots appear. - Check the study names displayed at the top of each window, and confirm that you see a result from Study 1 and one from Study 2.
Typically, Study 1 appears in the left window, and Study 2 appears in the right window. - If necessary, use the study selector at the top of a window to select a different study to display.
Note: Each window has its own study selector and result selector at the top of the window. The ViewCube and Navigation Toolbar are only visible in the active window.
- Click
Verify that synchronization is active (default setting).
- Note that
 Synchronize Camera and
  Synchronize Result Type are already active by default (indicated by blue highlighting on the toolbar).
With these synchronizations active, when you rotate the model or switch results in one window, the changes apply to both windows automatically. - Click Synchronize Legend to deactivate it (if it is active).
With unsynchronized legends, each window displays its own legend scale, making it easier to compare the relative differences between the two studies.
- Note that
Switch to the Displacement result and compare the X-displacement in Study 1 with Study 2.
- Click in the left window to activate it.
- Use the result selector at the top of the window to select Displacement > X.
The X displacements appear in both windows.
Observations- Because one end of the Study 1 model is fixed, and the force stretches the assembly in the -X direction, all X displacement results are negative.
- For Study 1, the maximum relative X displacement magnitude for the assembly is about 0.0035 in.
- Since the Study 2 model is being acted on by +X and -X forces, positive and negative X displacement results are evident. The zero-displacement area is near the middle of the connecting rod span.
- The displacement variation for Study 2 is 0.00264 in to about - 0.00154 in. Therefore, the maximum relative displacement for the assembly is 0.0026 - (-0.00154 in), or approximately 0.0042 in.
- The deformation of the assembly is greater in Study 2, which is not surprising. The small pin is free to bend more without the fixed constraints on the end faces.
Switch to the Stress result and compare the von Mises stresses in Study 1 with Study 2.
- Use the result selector at the top of the window to select Stress > Von Mises.
The von Mises stresses appear in both windows.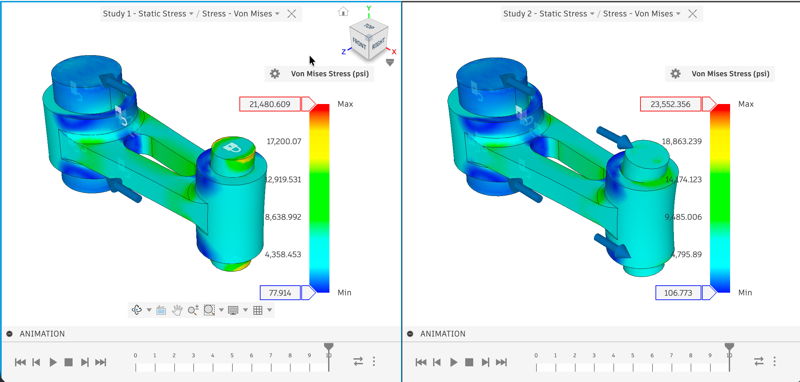
Observations- The maximum von Mises stress for Study 1 is between 21,600 and 21,700 psi. The location, as we saw previously, is at the edge of the short pin. This pin behaves as a built-in beam, where the greatest moment occurs at the end supports.
- The maximum von Mises stress for Study 2 is approximately 24,300 psi. It occurs on the surface of the small pin at its mid-length.
Tip: If desired, you can temporarily return to the Results tab to hide parts and to show the Min/Max probes, which are not available in the Compare tab. Do this to locate the maximum result when it is located on hidden faces. - The Study 2 stress exceeds the Study 1 stress by approximately 12%.
- Use the result selector at the top of the window to select Stress > Von Mises.
Switch to the Safety Factor result and compare Study 1 with Study 2.
- Use the result selector at the top of the window to select Safety Factor.
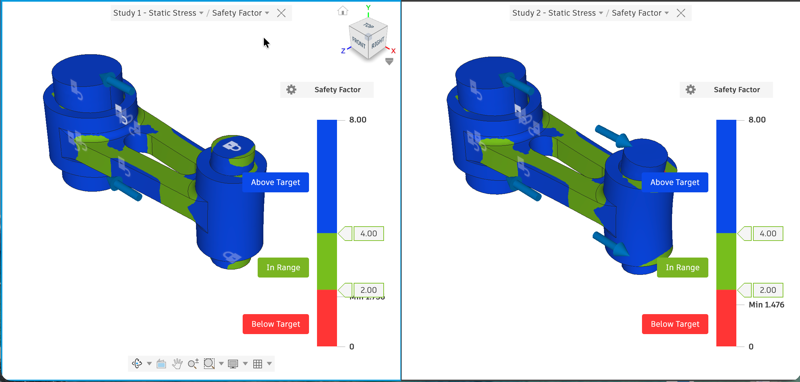
Observations- The safety factor results reflect the increased stress level in Study 2, where the safety factor is 25% lower than that of Study 1.
- Use the result selector at the top of the window to select Safety Factor.
Switch to the Contact Pressure result and compare Study 1 with Study 2.
- Use the result selector at the top of the window to select Contact Pressure.
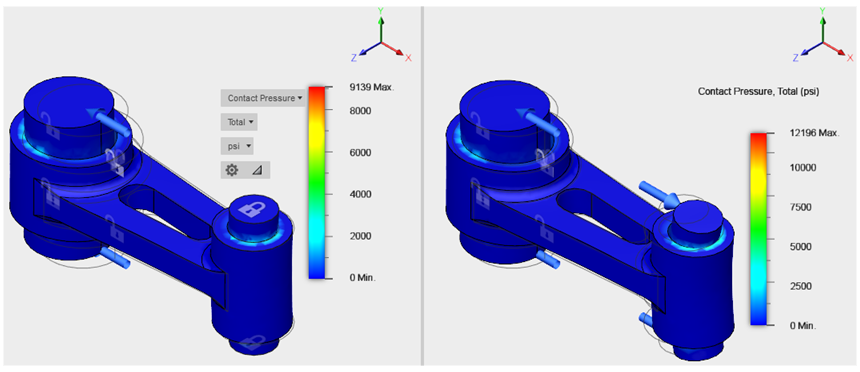
Observations- The greater amount of small pin bending deflection in Study 2 results in a more localized contact area near the edges of the connecting rod hole. The end result is an 33% increase in contact pressure for Study 2, which is not surprising.
- Use the result selector at the top of the window to select Contact Pressure.
Activity 6 summary
In this activity, you
- Synchronized the views, so that switching one result switched the result in the other study, simultaneously
- Compared the displacement results for the two studies
- Compared the stress results for the two studies
- Compared the safety factor results for the two studies
- Compared the contact pressure results for the two studies.