Activity 4: Solve the analysis and review the results
In a Nonlinear Static Stress study, the solution is computed over several increments. In this tutorial, the pressure load on the beam is applied gradually over 60 steps, enabling you to view the effect of the load over time.
In this activity you
Solve the study
Determine if the beam is likely to collapse
Identify when the Safety Factor drops below 1
Review the von Mises Stress result to see how the stresses change as the support beam is loaded
Examine the Displacement result to identify when the displacement begins to increase exponentially.
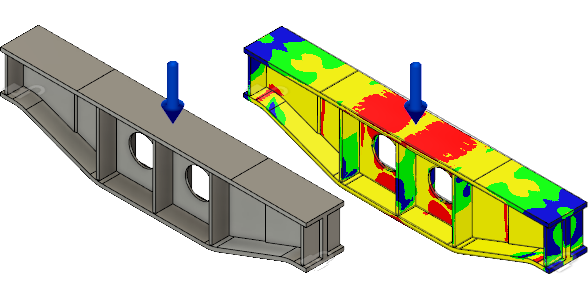
Support beam model with constraints and loads applied (left) and the nonlinear static stress safety factor result (right).
Prerequisites
- Activity 3 is complete.
Steps
Solve the study.
- Click
 (Simulation workspace > Setup tab > Solve panel > Solve), to open the Solve dialog.
Note: The Pre-check icon shows a green checkmark, which indicates that there are no warnings and the model is ready to solve.
 - Select your study to be solved.
- Click Solve 1 Study to run the analysis and close the dialog.
Note: Meshing and solving the analysis can take several minutes.
- When the analysis is complete, click Close to close the Job Status dialog.
The Results tab opens automatically, so you can view the results.
- Click
View the Safety Factor results and determine whether the beam is likely to collapse under the applied load.
- The Safety Factor result at Step 60 is displayed the first time the study solution is completed. However, if you rerun the solution, the most recently viewed result is retained at completion. If necessary, choose Safety Factor from the results drop-down list near the legend.
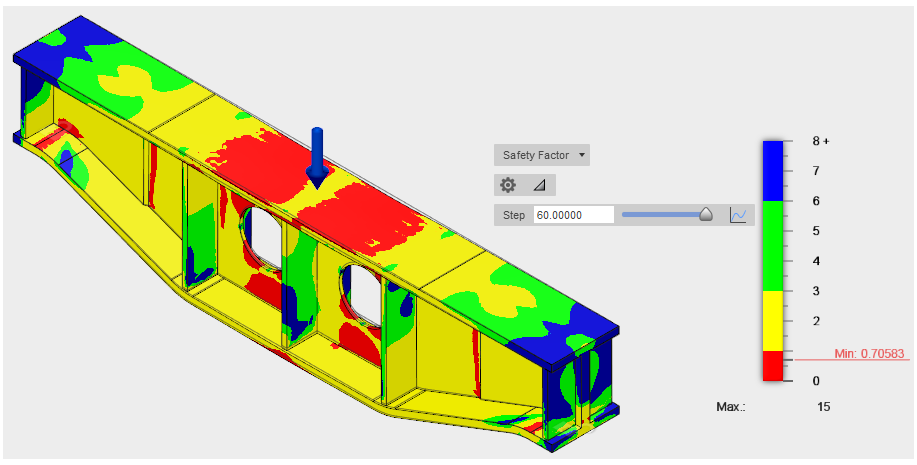
- Drag the slider back and forth to see how the safety factor varies as the load increases. The load ramps up linearly throughout the simulation at a rate of 5 kN per step (5 kN * 60 steps = 300 kN).
Note: The minimum safety factor is approximately 0.7, indicating that the yield strength of the material has been significantly exceed. Additionally, a large portion of the contour part is red. Therefore, permanent deformation has surely occurred, and the beam is in danger of collapsing under the applied load.
- The Safety Factor result at Step 60 is displayed the first time the study solution is completed. However, if you rerun the solution, the most recently viewed result is retained at completion. If necessary, choose Safety Factor from the results drop-down list near the legend.
Use the Transient Results Plot to identify when the safety factor drops below 1.0.
- In the plot legend area, click the
 2D Chart icon to the right of the Step slider.
Tip: Click and drag the Transient Results Plot title bar to relocate the plot window. Also, you can click and drag the lower right corner of the window to resize it.
- Click and drag the time marker line on the graph to locate the point at which the safety factor drops to 1.0.
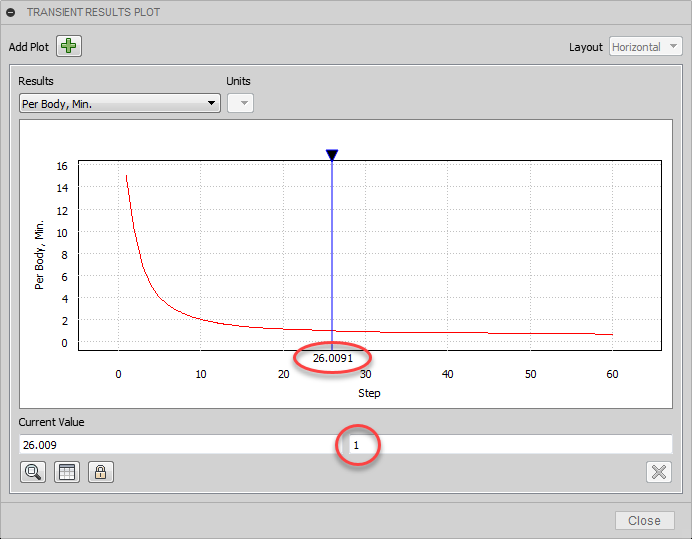
Notice that the safety factor crosses through 1.0 at approximately the 26th calculation step. From this observation, we can conclude that the load becomes critical at about 43 percent of the applied load, or 130 kN:(Step 26 / 60 Steps = 0.433, and 0.433 * 300 kN = 130 kN.)
- Click Close to dismiss the graph.
- In the plot legend area, click the
View the von Mises stress result to see how the stresses change as the support beam is loaded.
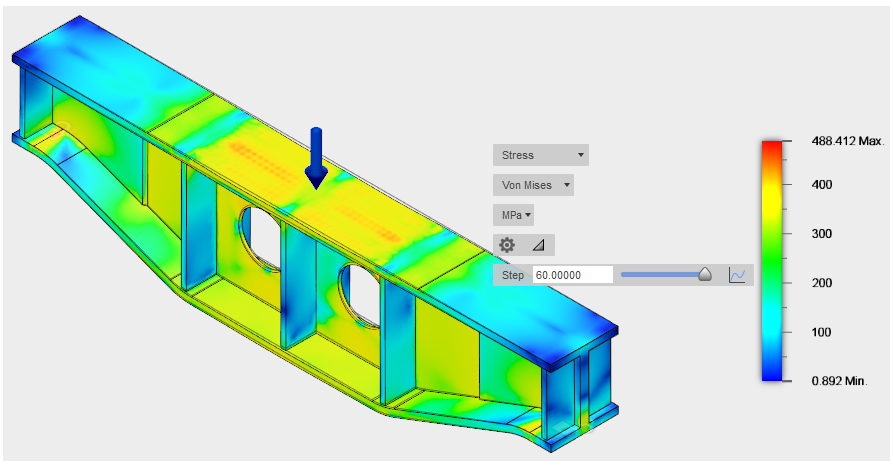
- Select the Stress result from the drop-down list. The default stress type displayed is von Mises.
- Drag the step slider to see how the stresses change as the support beam is loaded.
- Click the
 2D Plot icon to view the Maximum von Mises stress throughout the load history.
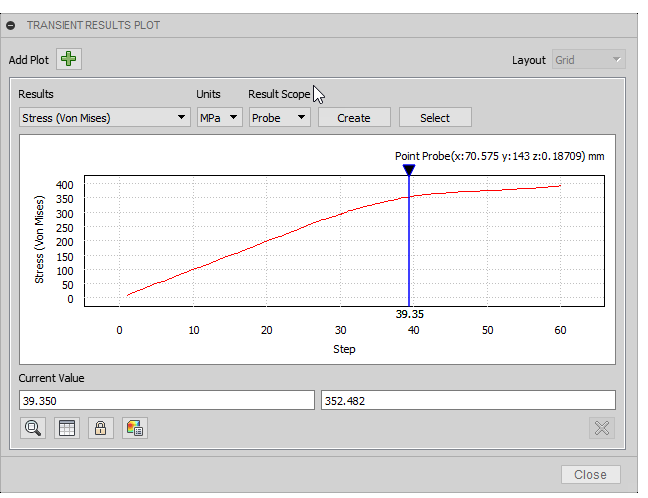
Here, the slider is positioned to show the point at which initial yielding begins, which is at approximately 233.7 MPa for this material.Notice the nonlinear response of the beam. As the load increases, the beam begins to yield. Once yielding initiates, the rate of stress increase declines. During this process, the material is work-hardening and actually becoming stronger. If we were to simply run a linear Static Stress study on the beam, we would only see the stresses on the beam at the end of the analysis. The predicted stresses would be much greater because the material is assumed to remain at its elastic stiffness (Young's Modulus).
Tip: If you look at the Basic Properties of the material, you see that the Yield Strength is significantly greater than the Initial Yield Stress shown under the Advanced (nonlinear) Properties. The reason is that the basic yield stress is the point at which the material stiffness is offset 0.2% from linear behavior. This 0.2% offset is the typical basis of material yield strength ratings. The nonlinear Initial Yield Stress is the point at which the stiffness just starts to deviate from Young's Modulus. You can see that the slope of the stress curve changes more rapidly once the basic yield strength (about 345 MPa) has been surpassed. - Click Close to dismiss the 2D plot.
View the Displacement result to identify when the displacement begins to increase exponentially.
- Select the Displacement result from the drop-down list near the legend.
The total displacement is shown by default. Unlike linear studies, the true displaced shape is shown by default for nonlinear studies. That is, the distortion is not exaggerated (though you can choose to do so). Therefore, the displacement looks less severe than what you might be accustomed to seeing in a linear static stress analysis. Don't let that fool you. Look at the actual displacement numbers.
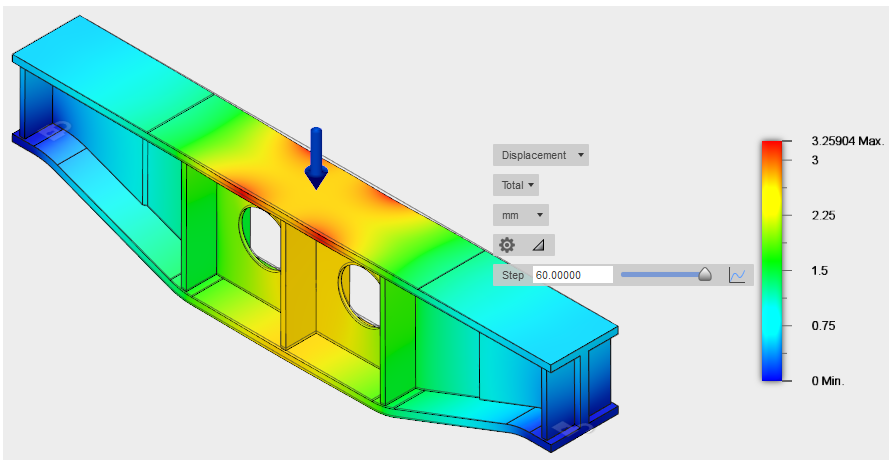
As you might expect, the maximum displacement occurs near the midspan of the beam and at the top flange, where the load is applied. - Click the
 2D Plot icon to view the Maximum Total Displacement throughout the load history.
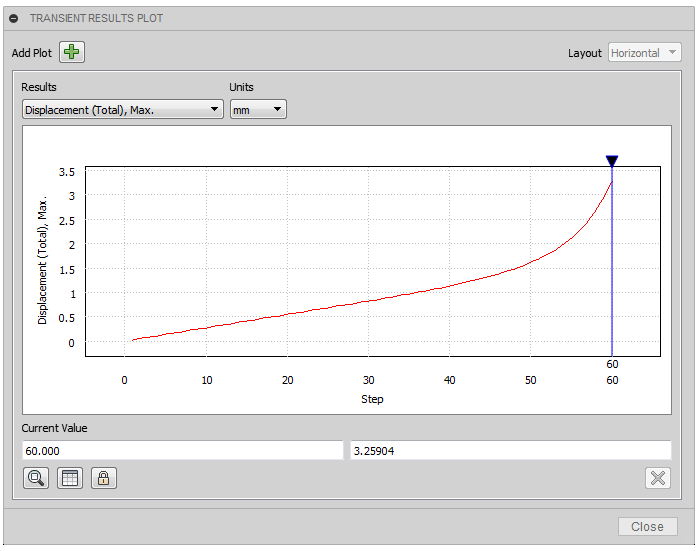
Notice how the displacement begins to increase exponentially at about the 45th calculation step. By the end of the simulation, the slope is quite steep. The stresses exceeding the yield strength spread out and penetrate more deeply, affecting a greater amount of the beam volume as the study progresses. Therefore, the material is no longer able to support the applied load. Clearly, the beam is on the verge of collapse.
- Select the Displacement result from the drop-down list near the legend.
Activity 4 summary
In this activity, you
- Solved the study
- Determined if the beam is likely to collapse
- Identified when the Safety Factor drops below 1
- Reviewed the von Mises stress result to see how the stresses change as the support beam is loaded
- Examined the Displacement result to identify when the displacement begins to increase exponentially.