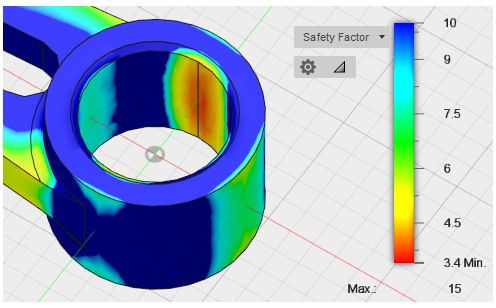
Safety factor result
All objects have stress limits that are dependent upon their construction material. Safety Factor is an important result that you can use to evaluate how suitable a design is for its intended application. The safety factor indicates if a design is likely to survive unharmed, bend, or break when subjected to the applied loads. There are various criteria and considerations influencing what the safety factor should be for a given material, manufacturing process, and application.
The Safety Factor result is produced by the following study types:
- Nonlinear static stress
- Static stress
- Thermal stress
Frequently, designers strive for a minimum safety factor between 1.5 and 6, depending on the application. Design safety factor compliance is based on the greatest expected loading scenario. However, lesser or greater safety factors might be targeted in certain cases.
Design safety factors typically exceed 1.0 by a significant margin. A safety factor less than 1 indicates that some sort of failure will occur (either permanent deformation or breakage). A safety factor of exactly 1.0 means that the actual stress equals the material strength limit, so the design is on the verge of failure.
The plot legend for Safety Factor results defaults to a range of 0–15. Also, an extra tick mark, numeric value, and the abbreviation Min in the legend scale indicates the actual minimum safety factor result. For example, the following legend indicates that the worst safety factor result is 3.4:


If a limited area of a design goes into yield, it does not necessarily mean that the part will fail. However, if the maximum expected load is frequently repeated or a relatively large percentage of the part volume yields, failure is likely. Use engineering principles and experience to evaluate each situation. Also, see the Factors Affecting the Choice of a Design Safety Factor page.