Activity 2: Solve the analysis and review the results
In this activity, you run the analysis and view the mesh, natural frequencies, and mode shapes of the tuning fork, to check its natural frequency. In this review of Study 1 - Modal Frequencies results, you
Check the mesh to ensure there are enough elements through the thinnest part of the tuning fork
Animate and view the 12 vibration modes, to identify which one to use to check the natural frequency of the fork
Determine the natural frequency of the selected mode, to see how it compares with the nominal frequency of 440 Hz for the A4 musical note
Identify if the tuning fork needs to be shortened or lengthened.

Tuning fork model (left) and Tuning fork Total Modal Displacement result for Mode 1 (right).
Prerequisties
- Activity 1 is complete.
Steps
Solve the study.
- Click
 (Simulation workspace > Setup tab > Solve panel > Solve), to open the Solve dialog.
Note: Even though the model is unconstrained, the Pre-check icon shows a green checkmark, which indicates that there are no warnings, and the model is ready to solve. The reason is that Modal Frequencies simulation models do not require constraints; the solver is able to output rigid-body vibrations as valid natural frequency modes.
 - Click Solve to run the analysis and close the dialog.
- When the analysis is complete, click Close to close the Job Status dialog.
The Results tab opens automatically, so you can view the results.
- Click
Display the mesh and check it to ensure there are at least four elements through the thinnest parts of the tuning fork.
- Click
 (Simulation workspace > Results tab > Finish Results panel > Finish Results) to switch to the Setup tab. The mesh lines are easier to see on a light gray background than on the dark blue of the contour plot.
 - In the Browser, click
 next to
  Mesh, to make the mesh visible.
Note: The specified mesh size results in four elements through the thinnest portion of the tuning fork. This is a good element size for accurately capturing flexure of the prongs. - In the Browser, click
 next to
  Mesh, to hide the mesh.
 - Click
 (Simulation workspace > Setup tab > Results panel > Simulation Results) to return to the Results tab.
- Click
Animate the Total Modal Displacement result for vibration Mode 1, using the Fastest speed, and the Two-way option to demonstrate the full vibration cycle.
- From the Mode drop-down list next to the plot legend, confirm that Mode 1 is selected.
- Click
 (Simulation workspace > Results tab > Result Tools panel > Animate) to open the Animate dialog.
 - Activate the Two-way option to create a repeating sinusoidal animation.
- In the Speed drop-down list, choose Fastest.
- Click
 Play.
Play.
Notice that the tuning fork does not deform; it only translates in the X direction. The natural frequency for the rigid body modes is 0 Hz (or approximately 0 Hz).
While the animation is still running, choose the next vibration mode from the Mode drop-down list next to the plot legend. Observe the shape of this mode. Repeat until you have seen all twelve vibration modes.
For each mode, observe the motion of the handle. Any mode that involves significant axial, radial, or torsional motion of the handle cannot be sustained. These modes will die out quickly when a person is holding the tuning fork.
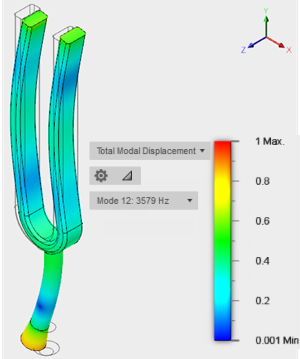
Your Mode 12 results should look like the following image:

Notice that the greatest displacement magnitude for Mode 12 is at the bottom of the handle, and it is in the +/- X direction. If someone is holding the tuning fork, this vibration mode will certainly die out almost immediately.
Identify the best vibration mode for tuning the fork, switch to it, and determine its natural frequency. You are looking for the mode which exhibits the least motion of the tuning fork handle.
- Revisit all the vibration modes using the Mode drop-down list next to the plot legend, and identify which ones show the least motion at the base of the handle.
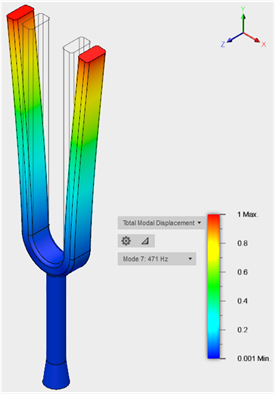
Only Mode 7 and Mode 11 exhibit minimal motion of the handle. These two modes are the only two of the twelve calculated modes that can be sustained while someone is holding the tuning fork. Both of these modes involve a slight amount of axial motion (Y translation) at the handle.
The relative axial motion is greater for Mode 11 and for Mode 7, so vibration Mode 11 will die out faster than Mode 7 does (the fundamental vibration mode).
- From the Mode drop-down list next to the plot legend, select Mode 7.
Your model should look like the image:
- In the Animate dialog, click OK to stop the animation and close the dialog.
- In the Mode drop-down list next to the plot legend, note the frequency next to Mode 7.
The natural frequency for Mode 7 is 471 Hz, which is about 7% higher than the nominal frequency of 440 Hz for the A4 musical note. Remember, that the goal is to produce a pitch of 418 HZ, which is 5% lower than the A4 note. The fork prongs have to be lengthened to lower the natural frequency of this mode.
- Revisit all the vibration modes using the Mode drop-down list next to the plot legend, and identify which ones show the least motion at the base of the handle.
Activity 2 summary
In this activity, you ran an analysis and reviewed the results. To check its natural frequency of the tuning fork, you
- Checked the mesh to ensure there were enough elements through the thinnest part
- Animated views the 12 vibration modes, to identify which one to use to check the natural frequency of the fork
- Determined the natural frequency of the selected mode
- Identified that the tuning fork needs to be lengthened.