Activity 6: Solve the analysis and compare the results
In this activity, you
- Run the analysis
- Inspect the temperature distribution throughout the radiator
- Activate the Compare environment
- Synchronize the views and compare the results.
Prerequisites
- Activity 5 is complete.
Steps
Solve the study.
- In the Browser, under Model Components, click
 next to Pipe to make them visible. All components involved in the simulation must be visible.
 - Click
 (Simulation workspace > Setup tab > Solve panel > Solve), to open the Solve dialog.
 - Click Solve to start the analysis and close the Solve dialog.
- When the analysis is complete, click Close to close the Job Status dialog.
The Results tab opens automatically, so you can view the results.
- In the Browser, under Model Components, click
Create Surface Probes to inspect the high temperatures, to see if there are any outlying results.
- Click
 Result Settings above the legend, and change the unit from K to C (celsius), if you prefer.
 - Click
 (Simulation workspace > Results tab > Inspect panel > Create Surface Probes)
 - Click the model at the edges of the fins in the higher temperature regions in a few places.
- In the Create Surface Probes dialog, click OK to stop creating probes.
- Compare the probes to validate there are no outliers that indicate that you may have misplaced a probe.
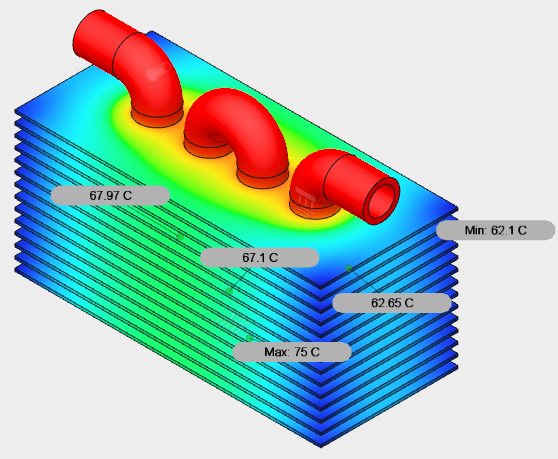
You can see that the temperature at the edge of the fins has dropped by several degrees. - Click
 (Simulation workspace > Results tab > Inspect panel > Hide All Probes), to hide the surface probes.
- Click
Access the Compare tab and select the studies to compare.
- Click
 (Simulation workspace > Results tab > Compare panel > Compare), to access the Compare environment.
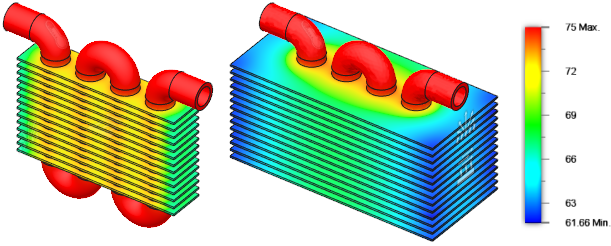
Two side-by-side contour plots appear. - Check the study names displayed at the top of each window, and confirm that you see a result from Study 1 and one from Study 2.
Typically, Study 1 appears in the left window, and Study 2 appears in the right window. - If necessary, use the study selector at the top of a window to select a different study to display.
Note: Each window has its own study selector, result selector, and legend. The ViewCube and Navigation Toolbar are only visible in the active window.
- Click
Verify that synchronization is active (default setting).
- Note that
 Synchronize Camera and
  Synchronize Result Type are already active by default (indicated by blue highlighting on the toolbar).
With these synchronizations active, when you rotate the model or switch results in one window, the changes apply to both windows automatically. - Click Synchronize Legend to deactivate it (if it is active).
With unsynchronized legends, each window displays its own legend scale, making it easier to compare the relative differences between the two studies.
- Note that
The improved temperature profile does come with a cost. The larger fins increase weight and material costs. Tuning your design to the right parameters may take several analyses.
Activity 6 summary
In this activity, you
- Run the analysis
- Inspect the temperature distribution throughout the radiator
- Activate the Compare environment
- Synchronize the views and compare the results.