Activity 5: Solve and review the results
In this activity, you solve the study. After the study has completed, and all incremental results have downloaded, you then inspect the mesh and the results to determine if the stresses experienced, as the bodies are pushed together, are likely to cause part failure. In this review of Study 1- Event Simulation results, you
- Solve the study
- Inspect the mesh to ensure that it represents the shape of the model adequately
- Create a slice plane to see the stresses at the locking fingers as the parts are pushed together
- Display the Normal ZZ Stress results to view the tension and compression experience by the fingers as they bend during assembly
- Graph the Maximum Normal ZZ Stress vs time to see how the bending stresses vary with time, in graphical format
- Animate the Normal ZZ Stress results to simulate how the bending stresses vary with time.
Prerequisites
- Activity 4 is complete.
Steps
Solve the study.
Click
 (Simulation workspace > Setup tab > Solve panel > Solve) to open the Solve dialog.
Confirm that Study 1 - Event Simulation box is checked.
Click Solve 1 Study to begin the solution process.
This model takes about 20–30 minutes to upload, solve, and download the results. The total time depends on the speed of your Internet connection and the level of concurrent solution activity on the cloud.
Temporarily display the mesh and hide the stationary body and inspect the local refinement you defined on the locking fingers.
In the Browser, click
 next to
  Mesh to make the mesh visible.
In the Browser, expand the Model Components folder, then expand the Bodies folder, then click
 next to
  Body 1 to hide the stationary body.
Rotate and zoom into the model to inspect the mesh.
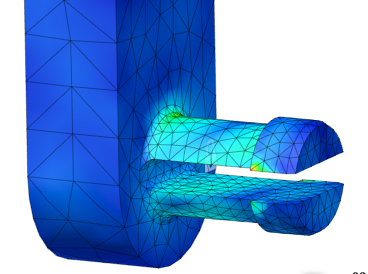
Notice that the mesh size is much smaller on the locking fingers, which means it can represent the shape of the model more accurately, and therefore provide more accurate results:
When you have finished,
- Click
 next to
  Mesh to hide the mesh again.
 - Click
 next to
  Body 1 to show the stationary part again.
- Click
Switch to the Displacement result and select the right side face of the moving body, to create a slice plane with a Z offset of 6.35 mm that passes through the center of the part.
Slice planes can be used to better see the stresses at the fingers as the parts are pushed together.
Using the results selector associated with the legend bar, switch from the default result, Stress, to the Displacement result.
Notice that there are exaggerated localized contact stresses where the moving part touches the stationary part, but these are unlikely to cause part failure. We are more interested in the stress where the locking fingers attach to the body of the moving part. Stresses in the stationary body are zero because we defined it as a rigid body. Since this part is fully fixed, it also has zero displacement.
Click
 (Simulation workspace > Results tab > Inspect panel > Create Slice Plane) to open the Slice Plane dialog.
Click the right side face of the moving part to select it.
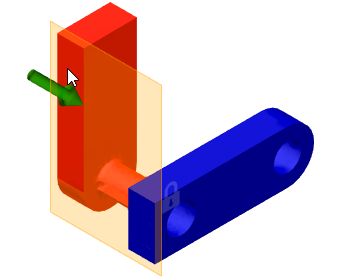
Using the manipulator arrows move the plane -6 mm, to the approximate center of the movable part.
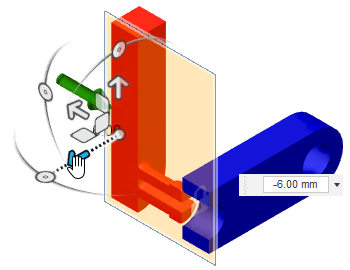
Type an offset distance of -6.35 mm to place the slice plane in the exact center of the 12.70 mm wide part.
When you have finished examining the internal stresses, in the Browser expand
 Results, then expand
  Slice Planes, then click
  next to
  Slice Plane:1 to hide it, so it doesn't obscure the contour plot.
Examine the tension and compression experienced by the fingers as they move into the stationary body.
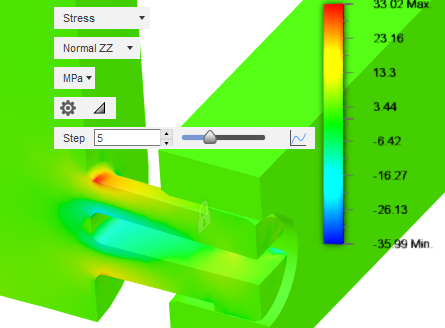
Bending of the fingers during assembly produces tension on the outside and compression on the inside. To focus in on these stresses, we look at the Normal ZZ stress tensor rather than the von Mises stress. These bending stresses act in the Z direction.
Using the results selector associated with the legend bar, change from the Displacement result to the Stress result.
Switch from von Mises to the Normal ZZ stress tensor, using the tensor selector below the results selector.
Drag the slider next to the Step field to see how the stress at the fillet varies during the event.
Create a 2D plot the Maximum Normal ZZ Stress versus the Time Step to see how the results vary with time during the simulated event.
Click
 2D Chart to the right of the Step slider to open the Trnasient Results Plot and view the graph of the maximum Normal ZZ stress over the event duration.
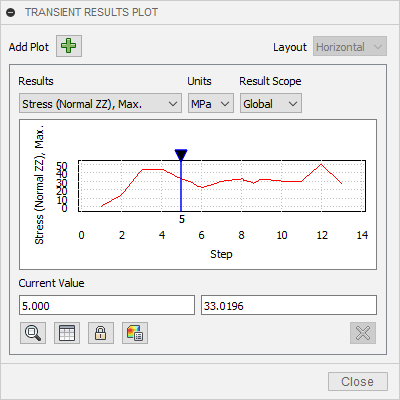
The result shows an increase in stress at the start as the fingers are inserted into the stationary part. The stress levels out as the fingers move through the stationary part and increase again at the end as they protrude from the hole and oscillate as they snap into place.
Note: The mesh is an approximation of the original geometry, with faces or facets that are not perfectly tangential to each adjacent face. As the nodes on one surface pass along the faces of the elements on the other part, the motion is not completely smooth.Move the step location to see the stress value at that step. You can do this by sliding the blue locator, or you can click
 Synchronize in the Transient Results Plot dialog, then change the step value by the legend.
When you are ready, click Close to close the Transient Result Plot dialog.
Animate the Normal ZZ Stress results to watch the stress change throughout the event, making sure that the legend range is consistent throughout the animation.
We can view an animation of the stress results throughout the event. To prevent the legend range from changing for each frame of the animation, we can override the automatic legend range.
Click
 (Simulation workspace > Results tab > Result Tools panel > Legend Min/Max) to activate the Max and Min fields by the legend.
Type 30 in the Max. field. (Do not press Enter.)
Type –30 in the Min. field, and press Enter.
Click
 (Simulation workspace > Results tab > Result Tools panel > Animate) to open the Animate dialog.
In the Animate dialog, select One-way.
One-way replays the animation continuously, in the forward direction only, until you press
 Stop.
Stop.Choose Fast from the Speed pull-down menu.
Type 26 in the Steps field.
There are 13 steps in the study output; the initial condition plus 12 calculated results steps. Therefore, two animation frames will be produced per results step. The results are interpolated between the actual output steps.
Press
 Play to view the animation.
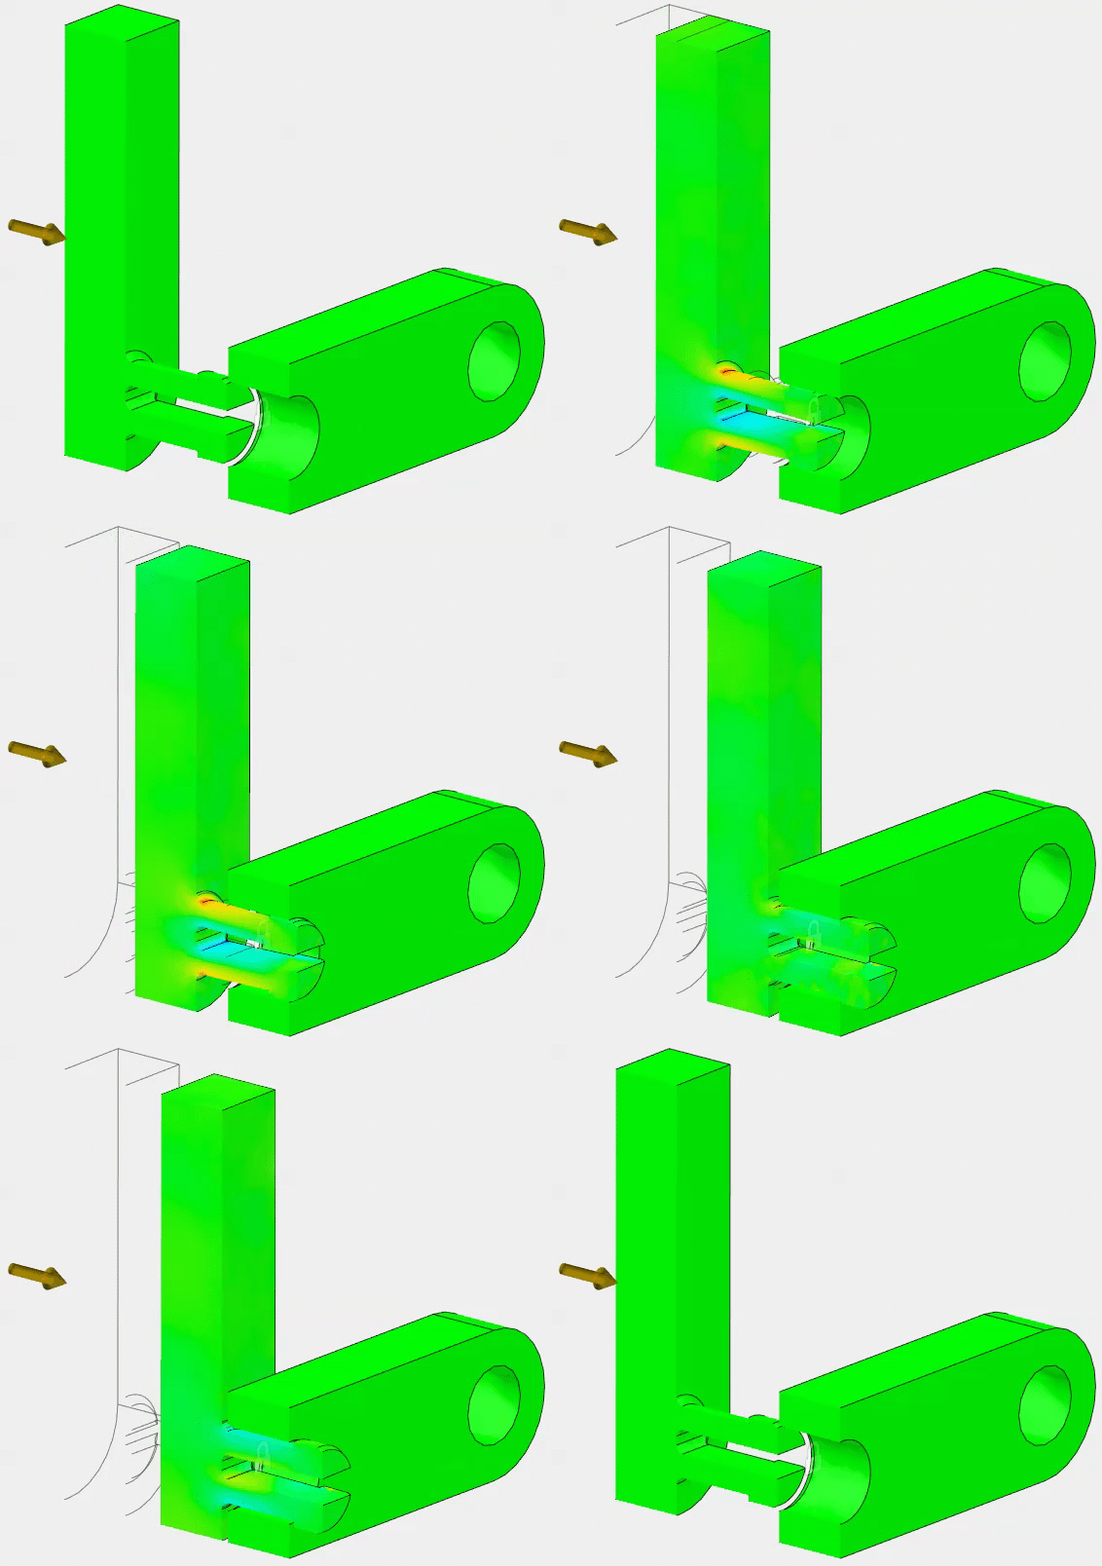
Notice the bending stress and displacement oscillations in the fingers after the parts are fully engaged. The Normal ZZ stress tensors reverse directions (positive-negative-positive) as the fingers bend upward and downward.
Click OK to stop the animation and close the dialog.
Activity 5 summary
In this activity, you
- Solved the study
- Inspected the mesh to ensure that there are no long, thin triangles, and that the mesh represents the shape of the model adequately
- Created a slice plane to see the stresses at the locking fingers as the parts are pushed together
- Displayed the Normal ZZ Stress Results to view the tension and compression experience by the fingers as they bend during assembly
- Plotted the Maximum Normal ZZ Stress vs time to see how the bending stresses vary with time in graphical format
- Animated the Normal ZZ Stress Results to simulate how the bending stresses vary with time