Activity 3: Review the results and Next Steps for the initial analysis
In this activity, you
- Determine how likely the part is to fill
- Determine whether the sink marks meet the design specifications
- Identify if the part is likely to be flat enough to connect with the opposite assembly part
- Animate the Fill Animation result to see if the fill pattern is balanced
- Check the the injection pressure does not exceed 50% of the machine's injection pressure capacity
- Review the suggested Next Steps and select two to try.
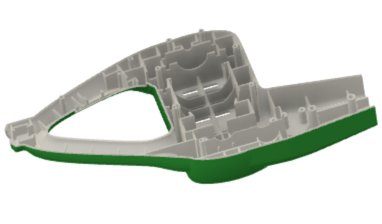 |
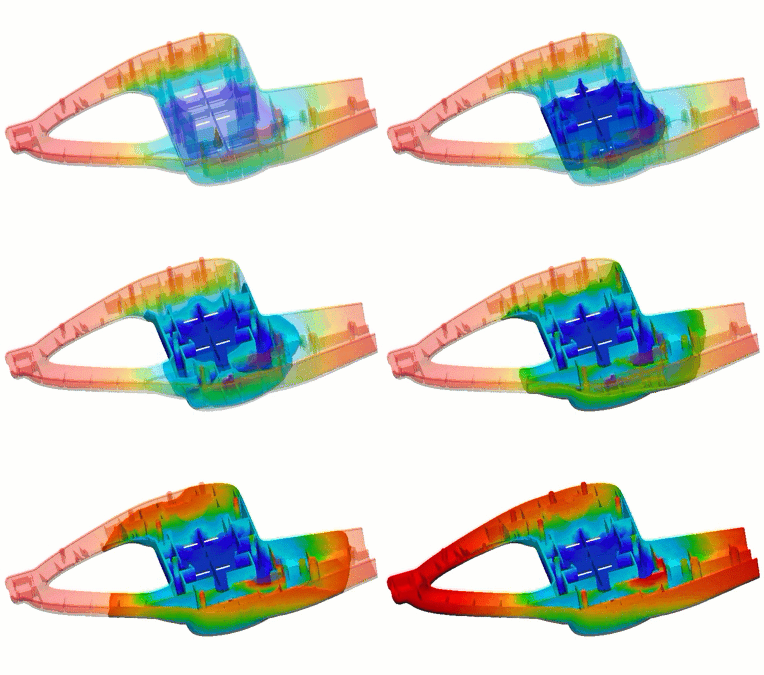 |
| Hedge trimmer model default setup | Animation showing the fill pattern |
Prerequisties
- Activity 2 is complete.
Steps
Using the Guided Results Fill tab, determiine how easily the part will fill, and where there might be difficulties.
On the Results tab, click
 (Display panel > Guided Results), to open the Guided Results.
In the Fill tab review the Fill summary and note that 0.089% of the model is unlikely to fill with the current model design and setup conditions.
Rotate the model and notice that there is a rib which is unlikely to fill.
Note: The Guided Results Fill result is the same as the standard Fill Confidence result, except that Guided Result interprets the data for you.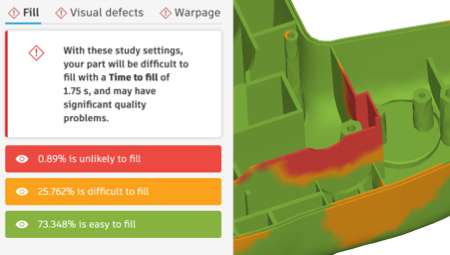
Using the Guided Results Visual defects tab, determine whether the sink marks depth meet a design tolerance of 0.05 mm.
On the Results tab,
 Guided Results, select the Visual defects tab.
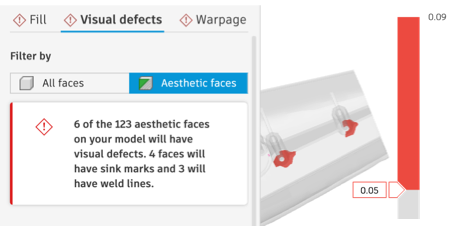
In the Visual defects tab, move the tolerance slider on the legend until it reaches 0.05 mm.
Rotate the model and notice that there are five areas where sink marks depth exceeds the design specifications.
Note: The Guided Results Visual defects result is the same as the standard Sink marks result and Weld lines result, except that Guided Result interprets the data for you. In the Guided Results, you can view the two results superimposed on the same model, or you can click the Visible icon to hide one or other result.
Using the Guided Results Warpage tab, identify whether, with these study setup parameters, the hedge trimmer model is likely to be flat enough to connect to its opposite assembly part, if the design tolerance is 1mm out-of-plane.
On the Results tab,
 Guided Results, select the Warpage tab.
In the Warpage tab, using the result selector above the legend, switch to the Flatness result.
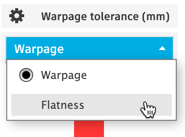 Note: The result summary information changes from warpage information to flatness information, when you switch result.
Rotate the model so the underside is facing towards you.
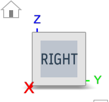
In the canvas, hover over the blue rim until all of it turns white, then click on it to select it.
Note: All selectable flat faces are highlighted for you in blue.In the Flatness dialog, uncheck Show flatness plane to see the result more clearly.
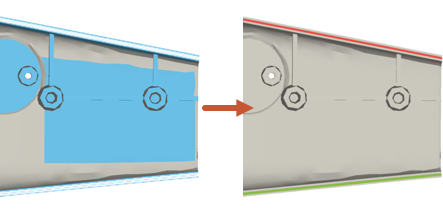
Move the tolerance slider on the legend to 1 mm.
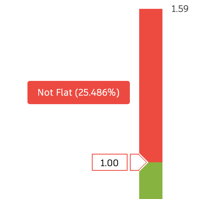
Notice that over 25% of the rim is now colored red, indicating that over 25% exceeds the out-of-plane design tolerance, and it may be difficult to connect the two parts of the assembly.
In the FLatness dialog, click Close to return to the Warpage result.
Animate the Fill animation result to see the fill pattern, and identify which areas where the melt struggles to fill the part in a balanced way.
On the Results tab, click
 (Display panel > Results), to show the standard results browser.
In the results browser, select the Fill animation result.
At the bottom of the canvas click
 Play.
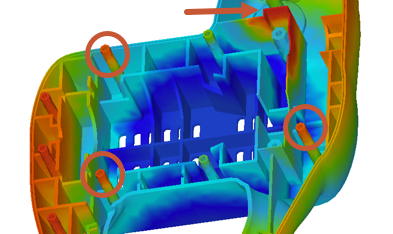
Play.Notice how the part fills. As the melt moves away from the center towards the two ends of the part, there are features in the center that do not fill until the very end. For some features (circled), this can be partially explained by the longer flow path. For other features, such as the rib, there may be a problem filling this area.
Check the injection pressure to confirm that it does not exceed 50% of the machine's injection pressure capacity of for an average (default) molding machine.
In the results browser, hover over the Injection pressure result to read the tooltip.
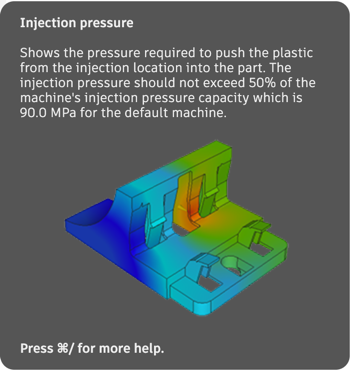
Notice that the injection pressure capacity for an average machine is 90.0 MPa. If you know the capacity of your machine, you can use that instead.
Once you have read the tooltip, select the Injection pressure result.
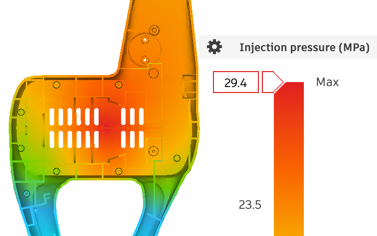
Notice that the maximum injection pressure is 29 MPa which is well below 50% of the machine's injection pressure capacity.
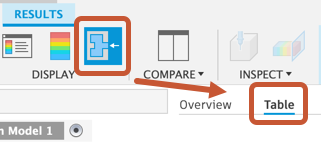
Note: You can also find the injection pressure in the study log by clicking (Display panel > Molding Process), then switching from the Overview tab to the Table tab.
Review the suggested Next steps and identify two changes you can make that will likely make the most difference to the result.
On the Results tab, click
 (Display panel > Guided Results), to return to the Guided Results.
In the Guided Results Warpage tab, review all the Next Steps.
Notice that there are two suggestions for editing the model, two for editing the Process Settings, and one for moving the injection location.
In the Guided Results, switch to the Visual defects tab and review the suggestions for improving the these results.
Again, the best way to reduce the visual defects is to modify the model and/or move the injection location.
In the Guided Results, switch to the Fill tab and review the suggestions for improving the likelihood of the part filling.
Here, the suggestions are to increase the thickness of thinner sections, move the injection location, and decrease the injection time.
As with any design problem, there is more than one solution you can use to improve the result. In the next activity, you clone the study and move the injection location, and also clone the Simulation model to increase the thickness of that problem rib, without modifying the original design model.
On the Results tab, click
 Finish Results to return to the Setup tab.
Activity 3 summary
In this activity, you
- Determined how likely the part is to fill
- Determined whether the sink marks meet the design specifications
- Identified if the part is likely to be flat enough to connect with the opposite assembly part
- Animated the Fill Animation result to see if the fill pattern is balanced
- Checked the the injection pressure does not exceed 50% of the machine's injection pressure capacity
- Reviewed the suggested Next Steps and select two to try.