Learn about each of the data layers that you can view on the Info360 Asset network map.
- Asset data
- Spatial data
- Inspection grades and observations
- Risk grades
- Rehab actions
Open the Layers panel
 to view your available layers, hide/show them, and see their color coding.
Asset data
Any asset GIS layers that you have imported into Info360 Asset are visible on the network map. These layers are listed under the corresponding system type.
From the map, you can also open a specific asset's details page with information such as asset properties, risk results, and rehab actions.
To open the asset details page:
- Select an asset on the map.
- In the panel that opens, click the three dots (
 ) and select View Details.
You can open a list of your assets (per type) by selecting the grid icon
 .
.
Spatial data
Any spatial data GIS layers that you have imported into Info360 Asset are visible on the network map. These layers are listed under the Spatial Data category.
You can open a list of your spatial data (per layer) by selecting the grid icon
.
Inspection grades
You can view the latest approved condition grade for your pipe and manhole assets from the map. When you select an asset, you can also access the latest inspection for more details.
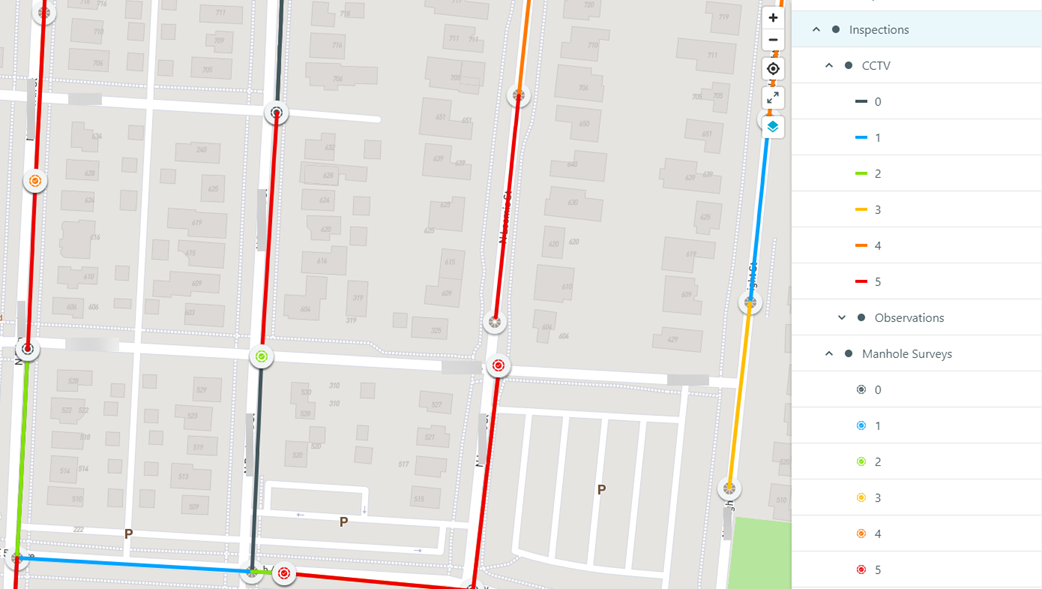
Pipes and manholes are colored based on the highest severity grade (0 to 5).
Pristine = 0, Excellent = 1, Good = 2, Fair = 3, Poor = 4, Urgent = 5.
To see the color scale used for inspection grades, open the map layers
and expand the Inspections section and the inspection type.
Inspection observations
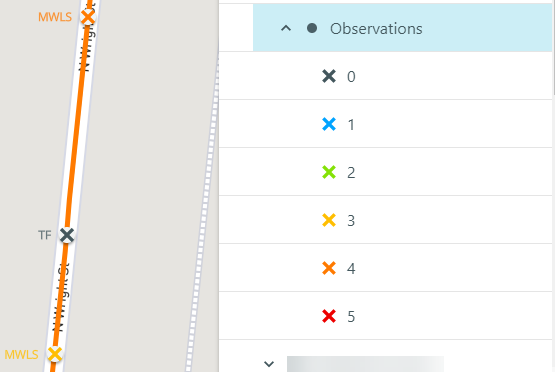
Observations for the latest approved pipe inspection are shown on the map with a colored cross located where the observation/defect occurs.
For PACP inspections, observations are colored according to their grade (0 to 5).
For MSCC and WSA inspections, observation scores are converted into a grade and then colored according to this grade (0 to 5). See About MSCC Inspection Scores and Grades or About WSA Inspection Scores and Grades for more information.
Individual manhole defect observations are not displayed on the map.
To see the color scale used for observations, open the map layers
and expand the Inspections section, the inspection type, and then Observations.
Risk grades
The latest risk grade for an asset is shown on the map. This grade is the result of the latest run of any published risk model that includes that asset. Grades range from Negligible to Extreme.
If you have several published risk models, a maximum of 10 of these will be available in the network map layers (in the order they were run). From there you can choose which risk model layer to show/hide on the map.
Rehab actions
The latest rehab action for an asset is shown on the map. This action is the result of the latest run of any published rehab decision tree that includes that asset.
If you have several published rehab decision trees, a maximum of 10 of these will be available in the network map layers (in the order they were run). From there you can choose which rehab layer to show/hide on the map.