If you have an InfoWater Pro subscription, you can add model simulation results to a workspace in order to compare these with real-world SCADA data and calibrate your model.
Create a Model Simulation workspace
To set up a workspace with InfoWater Pro simulation results:
- First, make sure you have shared your simulation results from InfoWater Pro. See how to do this in this short video:
You can see a list of simulations that have been shared from InfoWater Pro in Data
 Simulations. You can also
publish simulations to the map or delete them from here.
Simulations. You can also
publish simulations to the map or delete them from here.
- Then, create your workspace. See
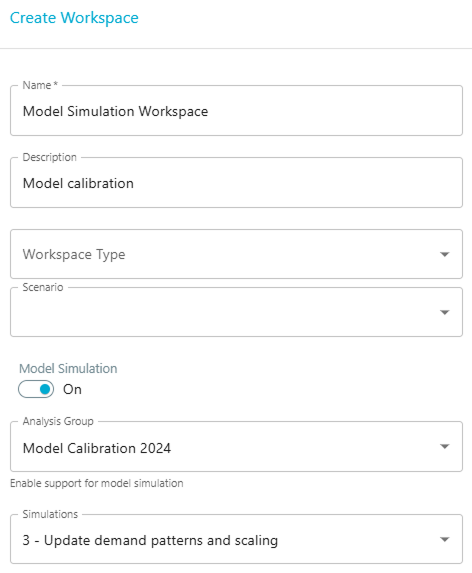
Create a Workspace for the workspace creation process. When creating, turn on the Model Simulation toggle and select the analysis group (your model) and the simulation you want to use. This simulation will be set as the default for the workspace. You'll be able to switch between simulations (though not analysis groups) once you've created the workspace.
Note: You can view simulation data in a historical chart in any workspace even if the Model Simulation toggle is not switched on, but you won't be able to switch between simulations so easily.
- Then click Create.
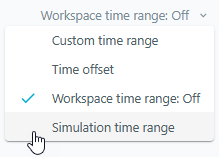
- Once created, you may want to switch the workspace time range to the simulation time range using the drop-down.
Add a historical chart with simulation results
Next, add historical charts with simulation results to your workspace:
- In your workspace, choose Add Component Historical Chart.
- As the Source Type, select Simulation.
- Click in the Simulation Data field and select the Analysis Group (your model), Simulation, Model Element Type, Output Type and Object ID (also known as the ModelElementID) for the data you want to include in your chart. For example, the pressure at a specific junction or the tank level for a specific tank.
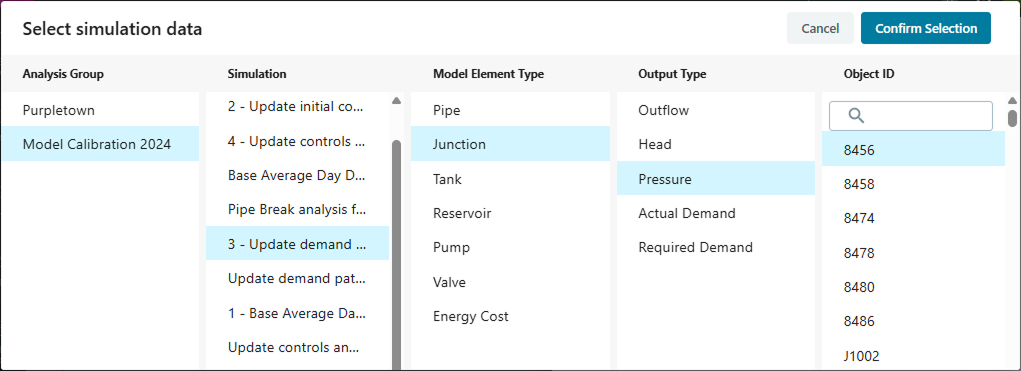 Note: The simulation data you select here will be considered the primary simulation data source and you will be able to change it using the Simulations drop-down. See more about switching simulations below.
 - Then click Confirm Selection.
- You can select a specific time range for the chart here if you want to, or you can leave it off and use the default workspace time range (which you can set to the simulation time range).
- Enter a chart name, description, and type. Then click Submit.
Now, if you want to compare the simulation results to SCADA sensor data or different simulation data, you can add these to your chart.
To add additional data:
- On the chart, click on the three dots icon
 Configure.
- Select + Add Source and choose the data source you want to add. If you select a sensor, you'll also need to choose the Function. See more about functions on the Create a Historical Chart page.
- Then click Add Source.
- Click Update.
Switching simulations
If you have turned on the Model Simulation toggle for your workspace (as described above), the workspace will show the default simulation you selected in the top-left, underneath the workspace name.
You can use the Simulation drop-down list to switch to another simulation. This will update the data series in all charts in the workspace that reference the currently selected default simulation to reference the newly selected simulation. Any data series that do not reference the currently selected default simulation will remain unchanged.
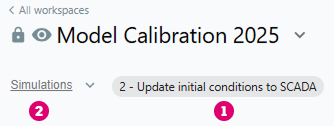
[1] Current default simulation for the workspace
[2] Click on Simulations to switch to another simulation
If you switch to a different simulation and also want to update all charts to show the time range for that simulation (if different), you can click on the drop-down arrow beside the time range and select Simulation Time Range again.