Phase Management - Summary Results shows details of the Inflow/Outflow Rates, Volumes and Pollutants for the current phase and for the current storm/event as highlighted on the Storm Selector (in the Status Bar). This form can be used to get a better idea of how the Site is performing as a whole, especially with regard to pollution reduction.
Inflow values are taken from all of the contributing Inflows.
Outflow values are taken from all of the Outfalls.
Simulation Health
If the results of the analysis are showing issues for the current storm a message will be shown at the top of the form. More information can be found in the Simulation Health section.
Additionally, the simulation health warning hyperlink can be clicked to display the Simulation Health Warnings for the current phase.
Phase Results
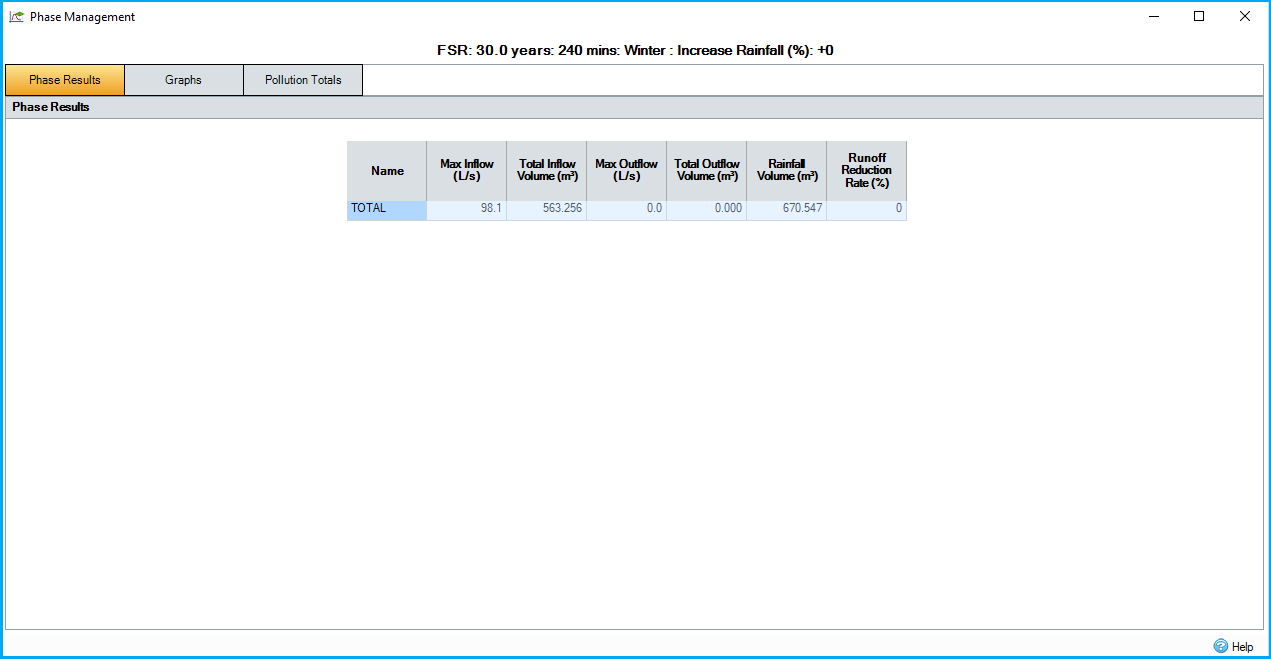
The table shows the overall inflow and outflow values for the phase together with details of the Runoff Reduction Rate. The final row shows total system results including Volume In, Volume Out, Max Inflow and Max Outflow for the current phase

Inflows
The peak inflow rate as well as the total inflow value is calculated from each of the inflows to the system.
Outflows
Each of the Outfalls in the system is shown on its own row to give a breakdown of the peak outflow rate and total discharge volume.
Rainfall Volume
For phases containing only Baseflow or Input Hydrographs rainfall volume will not be available.
This is the volume of water landing on the phase areas together with the total volume from any Input Hydrographs.
Rainfall Volume = Rainfall Depth * Total Area + Total inflow volume from Hydrographs
Runoff Reduction Rate
This shows the overall reduction in runoff volume when compared to the Rainfall Volume.
Runoff Reduction Rate = 1 - (Outflow Volume / Rainfall Volume)
Decimal Places
The information is shown to a default number of decimal places, based on the unit. If you want to see more or less decimal places, you can select Increment Decimal or Decrement Decimal from the right click menu. This setting will not be saved between sessions.
Graphs
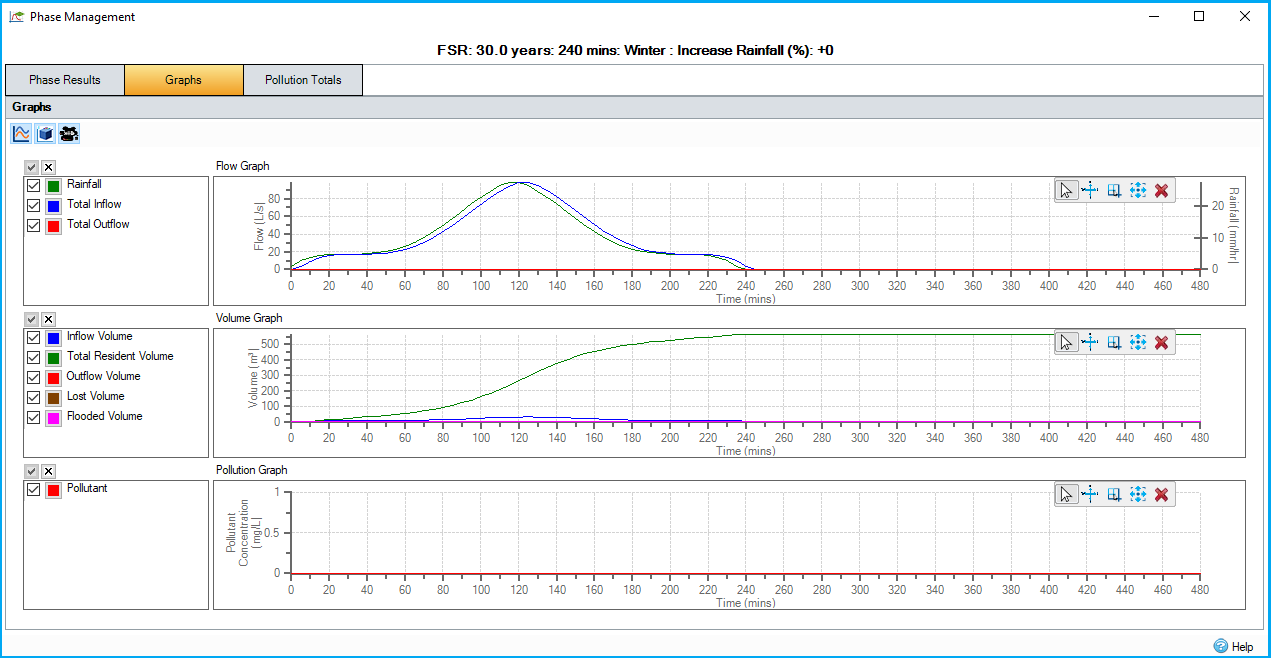
Provides 3 graphs showing different aspects of the total system result, each of which can be turned on and off as required. For more information, see the Graph Tools and Results Graphs pages.

Flows - shows the Inflows and Outflows into/from the Phase against time. For phases containing only Baseflow or Input Hydrographs rainfall will not be available.
Volumes - Shows the Resident and Lost volume(s) in/from the Phase against time.
Pollution - Shows the Pollutant concentrations in the Phase against time.
Pollution
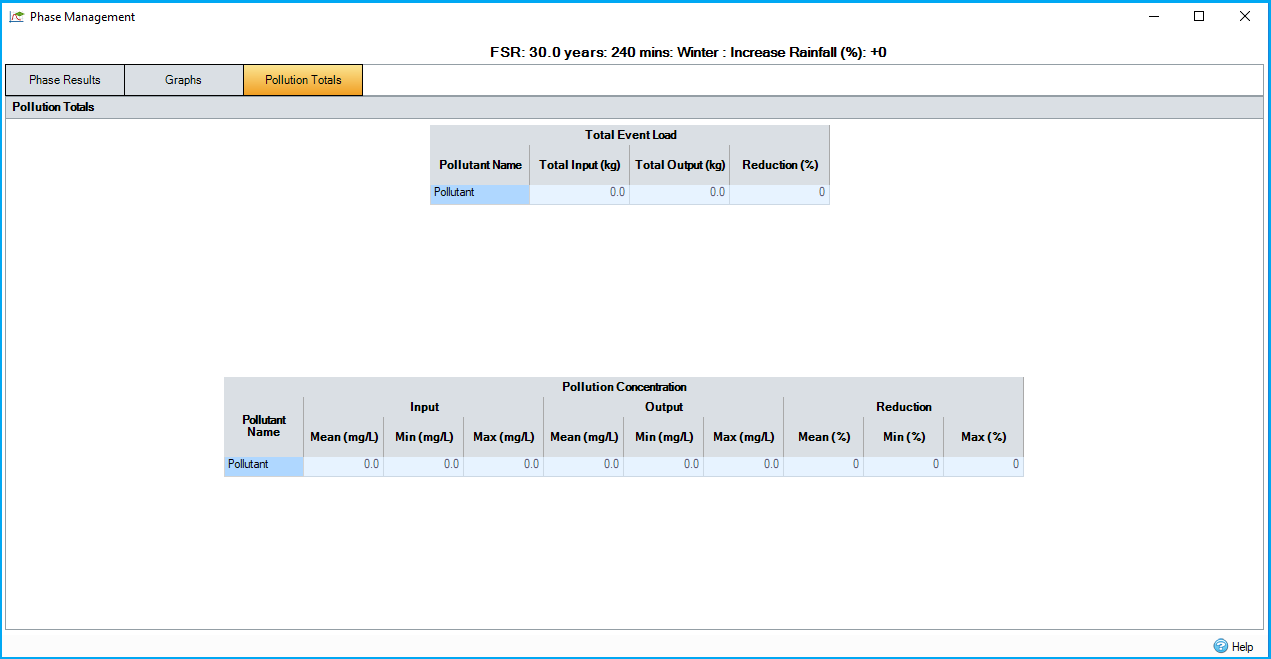
Provides a break down of the Pollutant loads entering and leaving the total system as well as details of the Concentrations. This tab is only available when there are pollutants on the site.

Total Event Load - Shows the total Input, Output, and Reduction for each Pollutant
Pollutant Concentration - Shows the Mean average, Minimum, and Maximum concentration for the Input and Output of each Pollutant. Also shows the Reduction in Mean average, Minimum, and Maximum Pollutant Concentration.