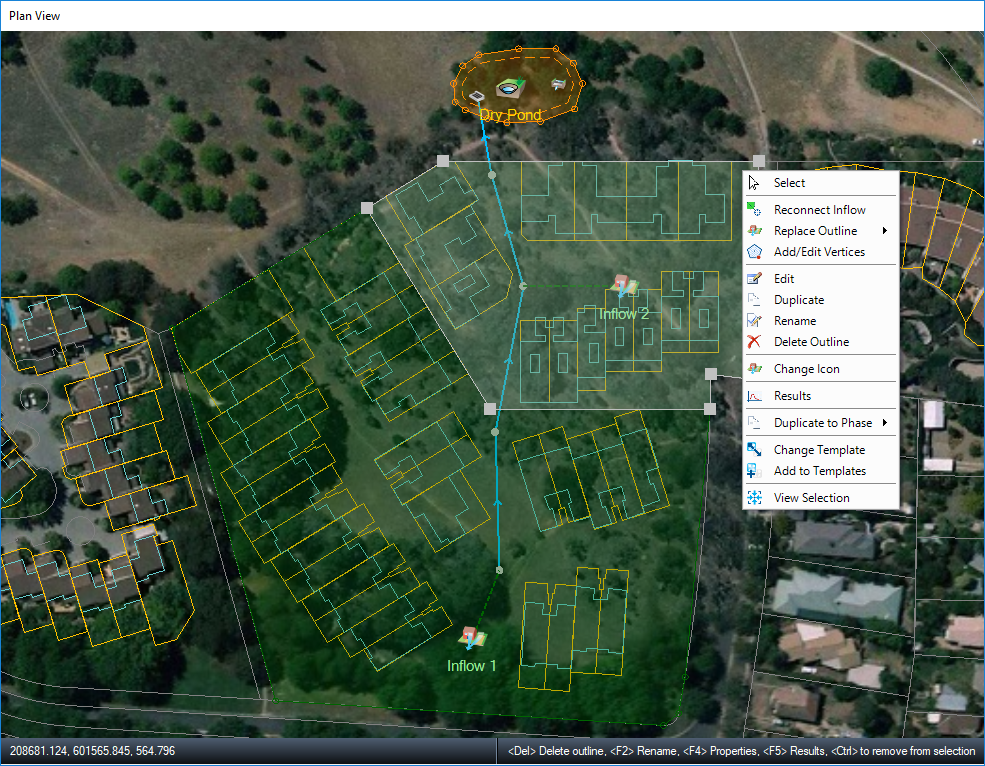
The Plan view is the main design surface in the software and shows the graphical layout of the site. The location of Stormwater Controls (SWC), Inflows, Inlets , Outlets, Land Uses, and Soil Types can be specified graphically. Also, drawing SWC areas and linking them with Connections can be done in this view.
New items can be added to the Plan by dragging them from the Toolbox. Items are highlighted on the Plan when they have focus on the Tree View.

Bypass Connections
A Bypass Connection can be added via the right-click menu on Plan or via the Build Ribbon. When hovering over an inlet, junction or stormwater control the right-click menu will show this option and the connections available.
When the Bypass Connection is drawn it is shown with a dotted line.
Hints
At the bottom of the plan are Coordinates and Hints. The coordinates section shows the current mouse location in world coordinates. An elevation is also shown if a TIN Surface Data has been loaded. Deluge results are also given if data is available.
The hints section details the typical actions available to you depending on the mouse position and the item that has focus on the Plan.
The center divider can be moved by dragging it with the mouse.
Flood/Flood Risk Indicators
When the current storm is being animated, the Plan can display a warning triangle over a Junction or SWC when the current water level enters the freeboard (Flood Risk, SWC only) or Floods. The display of the warning triangles is controlled by the flood indicators view option under the Results section of the Tree View. The images used are:
| Flood Risk Indicator | Flood |
|
|
|

