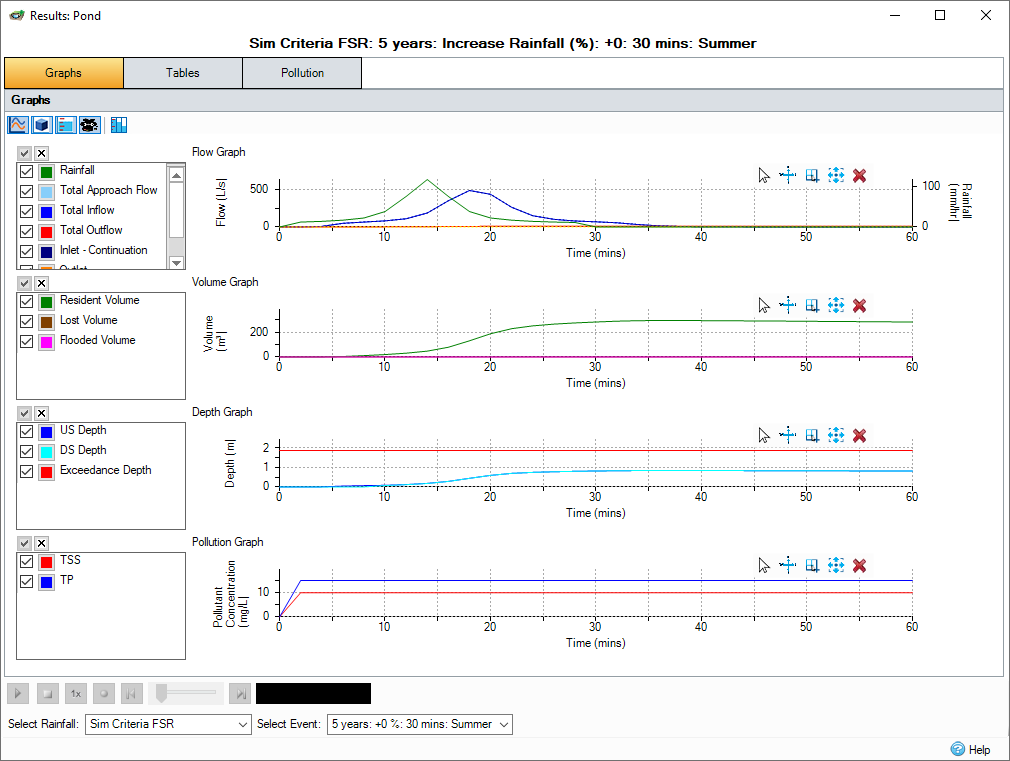
The Stormwater Controls - Item Results option shows a summary of how the selected Stormwater Control performed for the current storm/event as highlighted on the Storm Selector.
Graphs
Provides four graphs showing different aspects of the result, each of which can be turned on and off as required. For more information, see the Graph Tools and Results Graphs pages.

 Flows - Shows the Rainfall, Total Approach Flow (entering the inlets), per Inlet (Continuation and Bypass), Total Inflow (After inlet restriction and lag time) and Outflows (Total and per Outlet) into and from the Stormwater Control against time.
For phases containing only Baseflow or Input Hydrographs rainfall will not be available.
 Volumes - Shows the Total Volume, Volume per section (e.g. Ponding Area and Filter Area in a Bioretention), Resident Volume, Lost Volume per section and Flooded Volume of water in the Stormwater Control against time.
 Depths - Shows the water Depth in the Stormwater Control against time. The Exceedance Depth (Cover Elevation - Invert Elevation) is shown for reference to identify when flooding occurs. For Stormwater Controls with multiple sections e.g. Ponding Area and Filter Area in a Bioretention the Base Elevation of the upper section is shown for reference and the water depth is also shown per section. For sloped controls, the upstream and downstream values are displayed for each section.
 Pollution - Shows the Pollutant concentrations in the Stormwater Control against time.
![]() Show intermediate depths - For sloped controls, between 0 and 3 intermediate depths may be shown. A color gradient between the selected upstream and downstream colors will be used to calculate the colous for the intermediate depth traces.
Show intermediate depths - For sloped controls, between 0 and 3 intermediate depths may be shown. A color gradient between the selected upstream and downstream colors will be used to calculate the colous for the intermediate depth traces.
Tables
Shows the minute by minute data from the analysis of the system. This includes the Inflows, Outflows, Depths and Volumes. The toggles can turn on and off columns as required.

 Component Inflow - When turned on, the Inflow per Inlet and Total Approach Flow are shown in addition to the Total Inflow.
 Component Outflow - When turned on, the Outflow per Outlet and Infiltration columns are shown in addition to the Total Outflow.
 Depth - When turned on, the Depth column (per section if applicable e.g. Ponding Area and Filter Area in a Bioretention) is shown. For sloped controls, the upstream and downstream depths are shown.
![]() Show intermediate depths - For sloped controls, between 0 and 3 intermediate depths may be shown.
Show intermediate depths - For sloped controls, between 0 and 3 intermediate depths may be shown.
 Lost Volume - When turned on, the Lost Volume per section columns are shown.
 Volume - When turned on, the Volume per section is shown in addition to the Total Resident Volume.
 Pollutant Concentrations - When turned on, the Pollutant Concentrations are shown.
The information is shown to a default number of decimal places, based on the unit. If you want to see more or less decimal places, you can select Increment Decimal or Decrement Decimal from the right-click menu. This setting will not be saved between sessions.
Output Interval
The output interval comes from the value selected in the Analysis Criteria. The results are averaged over the output interval period. For example, if the Output Interval is 5 minutes and the Analysis Interval is 1 minute, the results calculated for the 1 - 5 minutes intervals are averaged to produce the 5 minutes result.
Pollution
Provides a break down of the Pollutant loads entering and leaving the system as well as details of the Concentrations.
