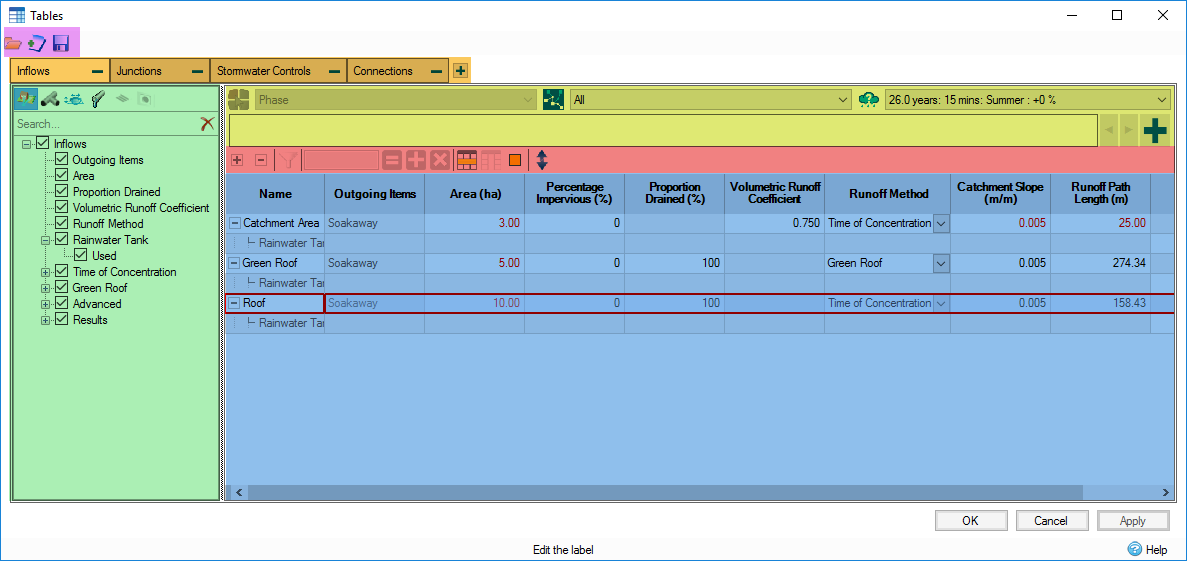
Tables is a spreadsheet view which provides a centralised display of the data available in your design. Tables provides easy comparison and filtering of Inflows, Junctions, Stormwater Controls - SWC, Connections and their associated data, such Inlets, Outlets Pollutants and Results information. Tables allows you to select which columns and items you want to be displayed.
Tables is accessed via the
Tree View, the
Build Ribbon or
Results Ribbon and is represented with this icon:
![]() . You can also press the function key F12 on your keyboard.
. You can also press the function key F12 on your keyboard.
|
|
|
General Toolbar
Allows the current configuration of all of the table views to be saved to a file and easily replicated later (in the initial design or a different one).
Open
- “Replace” functionality loads the tables contained in the target file and replace the tables currently available.
- “Append” functionality adds the tables contained in the target file to the current set of tables.
New
- Removes the current configuration and layout of the tables and re-apply the default layout (also removes any filters).
Save
- Save the current configuration and layout of the tables to allow this layout to be reapplied later to another set of data.
Table Selector
The table selector allows you to have multiple tables showing different sets of data and easily switch between these. By default Tables opens with four tabs, one for each of the main object types: Inflows, Junctions, Stormwater Controls and Connections. Inlets and Outlets can also be displayed alongside Junctions and Stormwater Controls.
Note that it is not possible to display objects of different types within one table, unless these objects are part of a Flow path.
Actions:
- Press "+ " to add a new table.
- Double click on the tab to edit the table's name.
- Press "- " to remove a table.
Selector View
The main purpose of the Selector View is to select which items and which columns will be visible in the Grid View. The Selector View can be collapsed by sliding left or clicking on the separator between the Selector View and the Grid View.
Item Selector
The item selector allows you to control the visibility of different items types (Inflows, Junctions, Stormwater Controls, Connections, Inlets and Outlets) and their associated columns in the grid. It also controls the item properties displayed in the property tree.
Results are available under each of the items if an analysis has been performed. These allow the same Summary information to be shown for each item as the overall Results forms.
Search Bar
The Search Bar allows a quick filtering of the items displayed in the property tree. Type one or several characters, these will be searched within all the property names, in any position (beginning, middle or end of any part of a property name).
Property Tree
The item selector allows you to manage the visibility of items and their associated columns in the grid. Properties related to a selected item are grouped together in a hierarchized and collapsible tree view.
Filters
These features help you to filter data so that you just access what is important to you.
Phase Filter
Display only the items associated with a given phase. This filter cannot be changed in this version of the software. Note that the Phase shown in Tables is synced with the Phase shown in the general InfoDrainage window.
Flow path Filter
You can either decide to display “All” items available or only items on a given flow path from the selected phase.
Storm Filter
The Storm Filter allows to display the result values associated to a storm after analyzing the design. This is synchronized with the Status Bar so changes here will update the other results shown in the software and vice versa.
Filter Bar
This tool provides you with a way to filter or highlight data available in the Grid View. To facilitate the visualization of your design, you can add one or several filters to refine the selection of items. The creation and modification of filters is accessed by following this procedure:
- Open the Filter Form: Press the “+” button on the right of the Filter Bar or double click an empty space in the Filter Bar.
- Modify filter values: Directly click an available filter, this opens the Filter Form (see below).
- Disable a filter: Press “-” on a filter in the Filter Bar.
Filter form
|
|
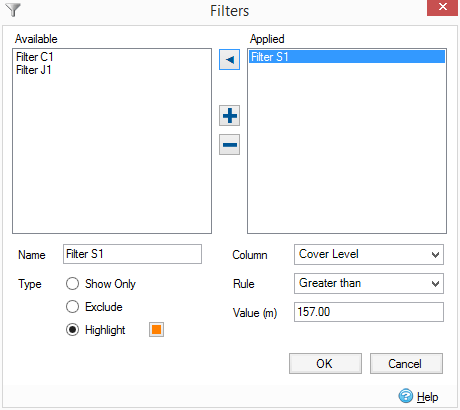
Available list: available filters not currently applied to the selected Table. Applied list: filters applied to the selected Table. Left/right arrow, plus and minus buttons: allow the creation and removal of filters and also a way to move filters from one list to another. If a filter is used in another table, it cannot be removed. Note that a filter created in one table will be available as well in other tables. |
Name: personalize the name of the filter.
Type: indicates how the filter will be applied to the grid according to the selected modes:
- Highlight data that matches the filter according to the selected color.
- Exclude data that matches the filter.
- Show only data that matches the filter.
Column: indicates which column the filter is applied to.
Rule: specifies the filter condition such as “different from”, “greater than”…
Value: Enter or select the value to be compared.
Grid Toolbar
The Grid Toolbar provides the following functionality:

|
Expands/collapses the items in the Grid View along with their properties. |

|
Turns on/off the filters available in the Filter Bar. |

|
Field for specifying a value to apply to a selection of cells when pressing one of the operators. |

|
"Equal " operator assigns the specified value to every selected cells. |

|
"Add " operator adds the specified value to every selected cells. |

|
"Multiply " operator multiplies every selected cells by the specified value. |

|
Highlights the current row. |

|
Highlights the current column. |

|
Color to be used for the highlight. |
Grid View
This is the component where the objects and their properties are displayed. Tables is a multidimensional view, it reflects data which you can access from the editor form of each items. Data is sorted and hierarchized to simplify browsing through the different parameters of items available in your design. As an example a Junctions would be shown as below:

In this case, any Inlets are not be listed in the "Manhole " row but underneath in the "Inlets " sub-row, this helps categorizing values and having a better visualization of the data.
Below is a list of features that the Grid View offers:
- An item selected in the Grid View is automatically selected as well in the Plan View & Tree View. The reverse is also true.
- Export options are available by right clicking on the grid.
- A red font indicates that a value previously calculated by InfoDrainage has been overridden by the user.
- Dragging the left extremity of the horizontal scroll bar or the top extremity of the vertical scroll bar allows you to split the view.
- Helper text for the currently selected cell is displayed at the bottom of the form, like in the Data forms.

 General Toolbar
 Table Selector
 Selector View
 Filters
 Grid Toolbar
 Grid View
