A map theme consists of multiple sub-themes, each of which uniquely controls the display of a specific map layer (junctions, pumps, valves, tanks, reservoirs, or pipes) based on either input or output variables.
You can choose the data breaks, colors, and symbol sizes for each sub-theme. You may also activate and customize data labels.
Map themes provide a dynamic and powerful way of categorizing your entire project visually based on defined criteria.
Using Map Themes in InfoWater Pro
The recommended workflow is to establish a library of sub-themes for each layer, and then combine these into map themes for common system views. You can then apply these views from the Model Explorer.
For example, you might want to apply a theme that sizes pipes based on diameter and junctions based on elevation while building a model, with a separate theme to view pressures on junctions with velocity or headloss with flow arrows on pipes when calibrating the model.
Map Themes
The top Map Theme section controls which map theme is active. A map theme is simply a selection of which underlying sub-themes are active.
- New - Creates a new blank theme, prompting for an ID and description.
- Rename - Opens prompt to define a new name or ID for the current map theme. This will update the name in the Operation tab after closing the window.
- Apply and Close - This will re-apply the full theme, including all sub-themes, then close the window.
- Clear Data - Clears the underlying map data along with all display settings for the theme. This forced reset can be helpful if the current table is not populating the table of breaks or appears outdated.
- Display Mode - Manage how the Map Theme displays in relationship with the domain.
- Entire Model - this option displays the Map Theme everywhere, regardless of the presence of any Domain.
- Symbology with Domain - this option will hide Map Theme layers from Domain Objects, so you can clearly see which objects are in the domain alongside the remaining themed objects.
- Domain Only - this option only displays the Map Theme on top of the Domain and nowhere else.
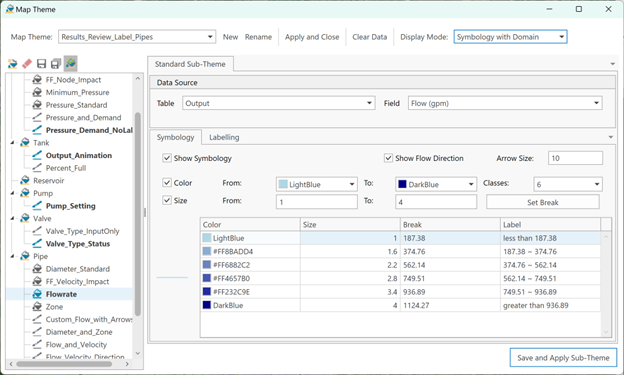
Map Sub-Themes
The left panel of the Map Themes window shows all sub-themes stored in the InfoWater Pro project, organized by element type.
Active sub-themes appear with bold text.
An asterisk * denotes the sub-theme has unsaved changes.
The following actions are available in the sub-theme tree view via the tool bar and right-click menus:
- New Sub-Theme - This action will create a new sub-theme of the element type selected in the tree.
- New ArcGIS Symbology Sub-Theme - This action is available from the right click menu on layer groups and it will create an ArcGIS Symbology Sub-Theme. Learn more about here.
- Delete - Deletes selected sub-theme.
- Clone - Creates new sub-theme with the settings of the selected sub-theme.
- Save - Saves changes to the sub-theme.
- Save All - Saves changes to all sub-themes.
- Activate/Deactivate - Makes the sub-theme active or inactive. When active, the selected sub-theme will be displayed any time the theme is applied.
Editing Sub-Themes
Select a sub-theme in the left panel to see and edit its settings in the main window. The Data Source must be defined using the Table and Field drop-down options in order to create a sub-theme. Outputs become available based on the current model output selected in the Model Explorer.
Symbology Tab
Use the options on the Symbology tab to break the range of values into classes and set the display colors and/or sizes:
- Color - Check this option to define a color range between two colors.
- Size - Check this option to vary the symbol sizes on a defined minimum to maximum range.
- Classes - The sub-theme will distribute the value range evenly from the min to the max numerical value using this specified number of classes.
- Set Breaks - Click this button to populate the table with the classes and their colors and/or sizes.
Other available commands:
- Show Symbology (default = on) - This controls whether the map layer will be rendered. This option is available for cases when text labels are desired while the object symbol remains unchanged.
- Show Flow Arrows (only for pipes) - This will produce an extra layer of flow arrows on top of pipes. This layer requires output to be available, though the data source of the sub-theme does not need to be an output.
- Arrow Size (only for pipes) – This option controls the size of arrows indicating flow direction in map units.
- Save and Apply Sub-Theme - This will save all changes and immediately apply the sub-theme to the map.
Labelling Tab
Text labels can be displayed for each object based on the specified data source.
- Show Label - Activates labels for the current sub-theme.
- Decimal – Round the label values to the count of decimals specified. A selection of 0 decimals will round values to the nearest integer.
- Title - This optional text input can be used to prefix each label. For example, you could define Title as "P=" for a pressure sub-theme so that every junction receives an annotation like "P=47.32 psi".
Note: The number of decimal places shown is controlled by the Decimal Placement display setting in project preferences.
- Show Unit - Option to display the corresponding units after each label. The unit is show in the Data Source field drop-down list.
- Symbol - Opens a window to manage the label text display, including font, size, and color.
- Placement - Opens a window to manage the placement of the text label relative to each model object.
Node Polygons
This polygon layer consists of Theissen polygons around each Junction, and allows joining and displaying Junction data or results onto the polygon for display purposes.
When creating a Node Polygon layer for the first time, the window will prompt you to create a Node Polygon Layer. Click New and use the tool to create polygons.
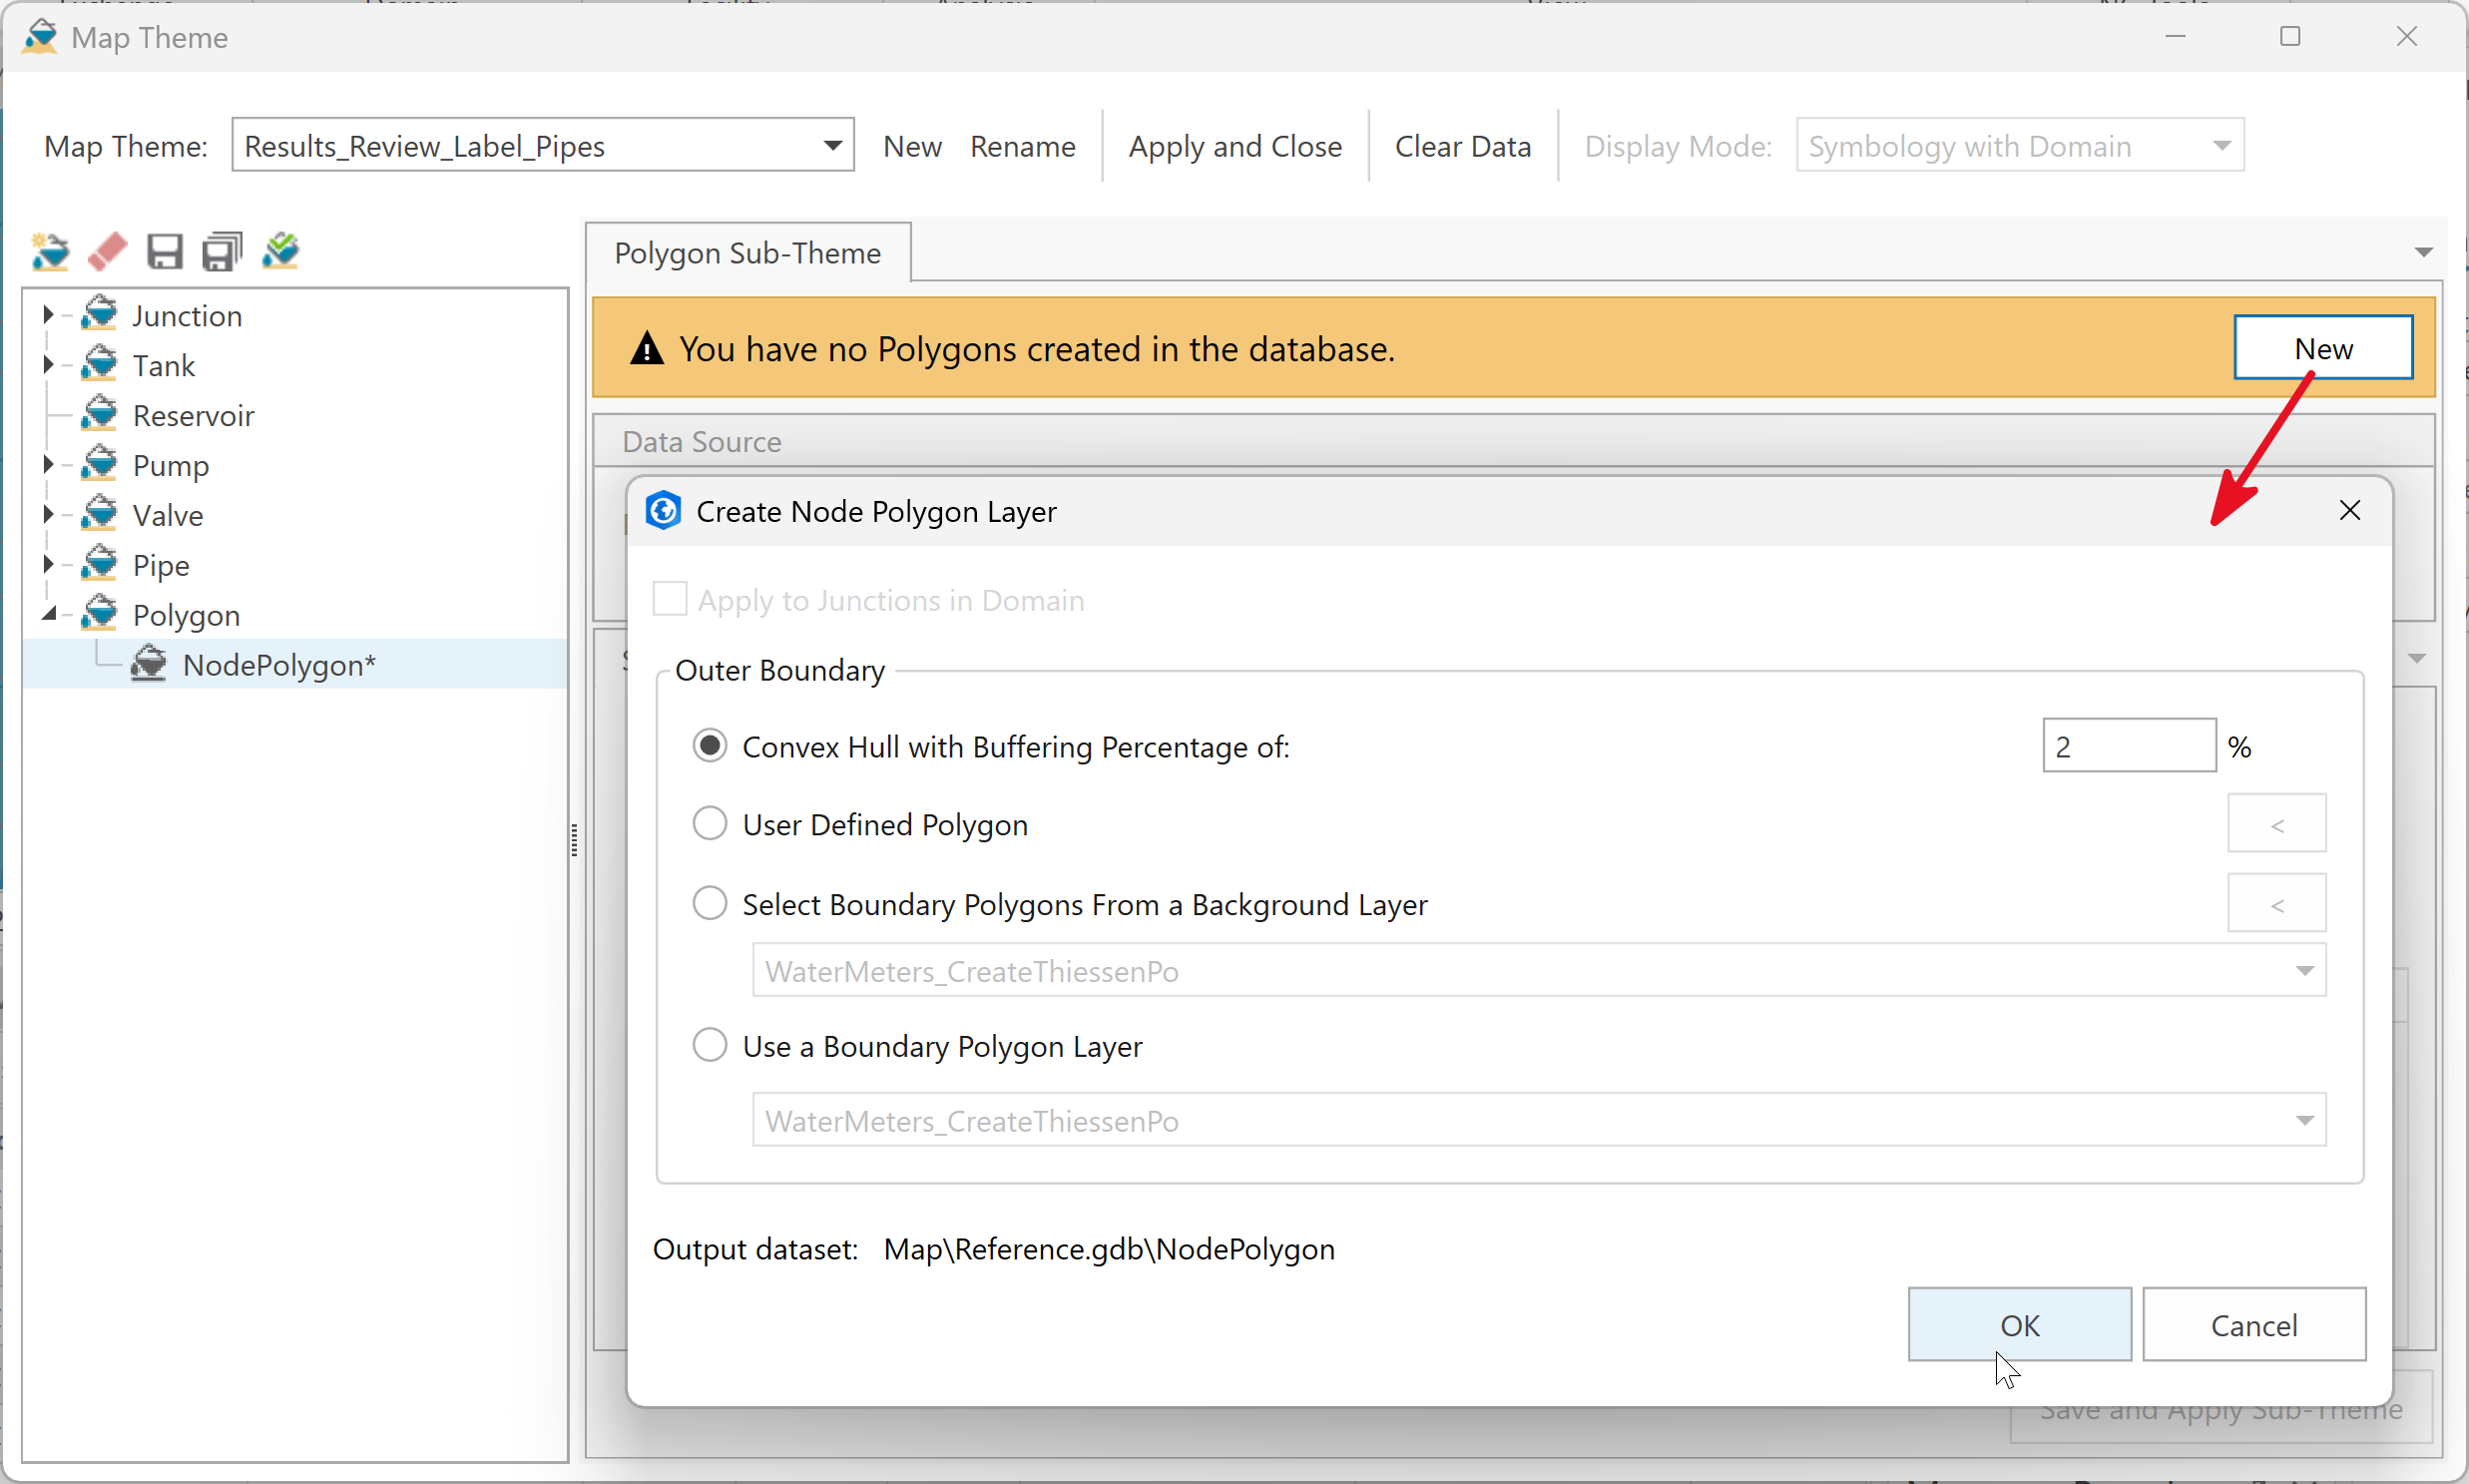
Outer Boundary
-
Convex Hull Technique - A process that uses a buffering percentage to determine the outer boundary of the final Thiessen polygon layer. A higher number represents a larger outside boundary while a value of zero would mean that the outer boundary is defined as a direct "dot-to-dot" between the outer-most junction nodes. You may need to run different percentages to become satisfied with the final result.
-
User Defined Polygon - Use this technique to manually define your polygon boundary. Thiessen polygons are then created inside the user-defined area, using your user-defined polygon at the outer-most boundary. To create the polygon, select the vertices with a single left-mouse click and complete the polygon with a double left mouse button click.
-
Select Boundary Polygons From a Background Layer - Select the outer boundary from an existing background layer. The existing layer needs to be first added to the project. This layer may consist of a data later that represents a pressure zone boundary or other bounding polygon. Use the Map Select button to choose a part or the whole of your model to define your "inner boundary" to create Thiessen polygons within the region bounded between the inner and the outer boundaries. To create the polygon, select the vertices with a single left-mouse click and complete the polygon with a double left mouse button click.
-
Use Boundary Polygon Layer - Use this method to create a boundary from an existing shapefile boundary polygon layer. The existing layer needs to be first added to the H2OMAP Water project. Specify the appropriate layer in the select box.
-
OK - Save and exit the Current dialog box.
-
Close/Cancel - Close the dialog box.
Once the Polygon layer is ready, the sub-theme dialog can be configured similar to other sub-themes for standard model layers.
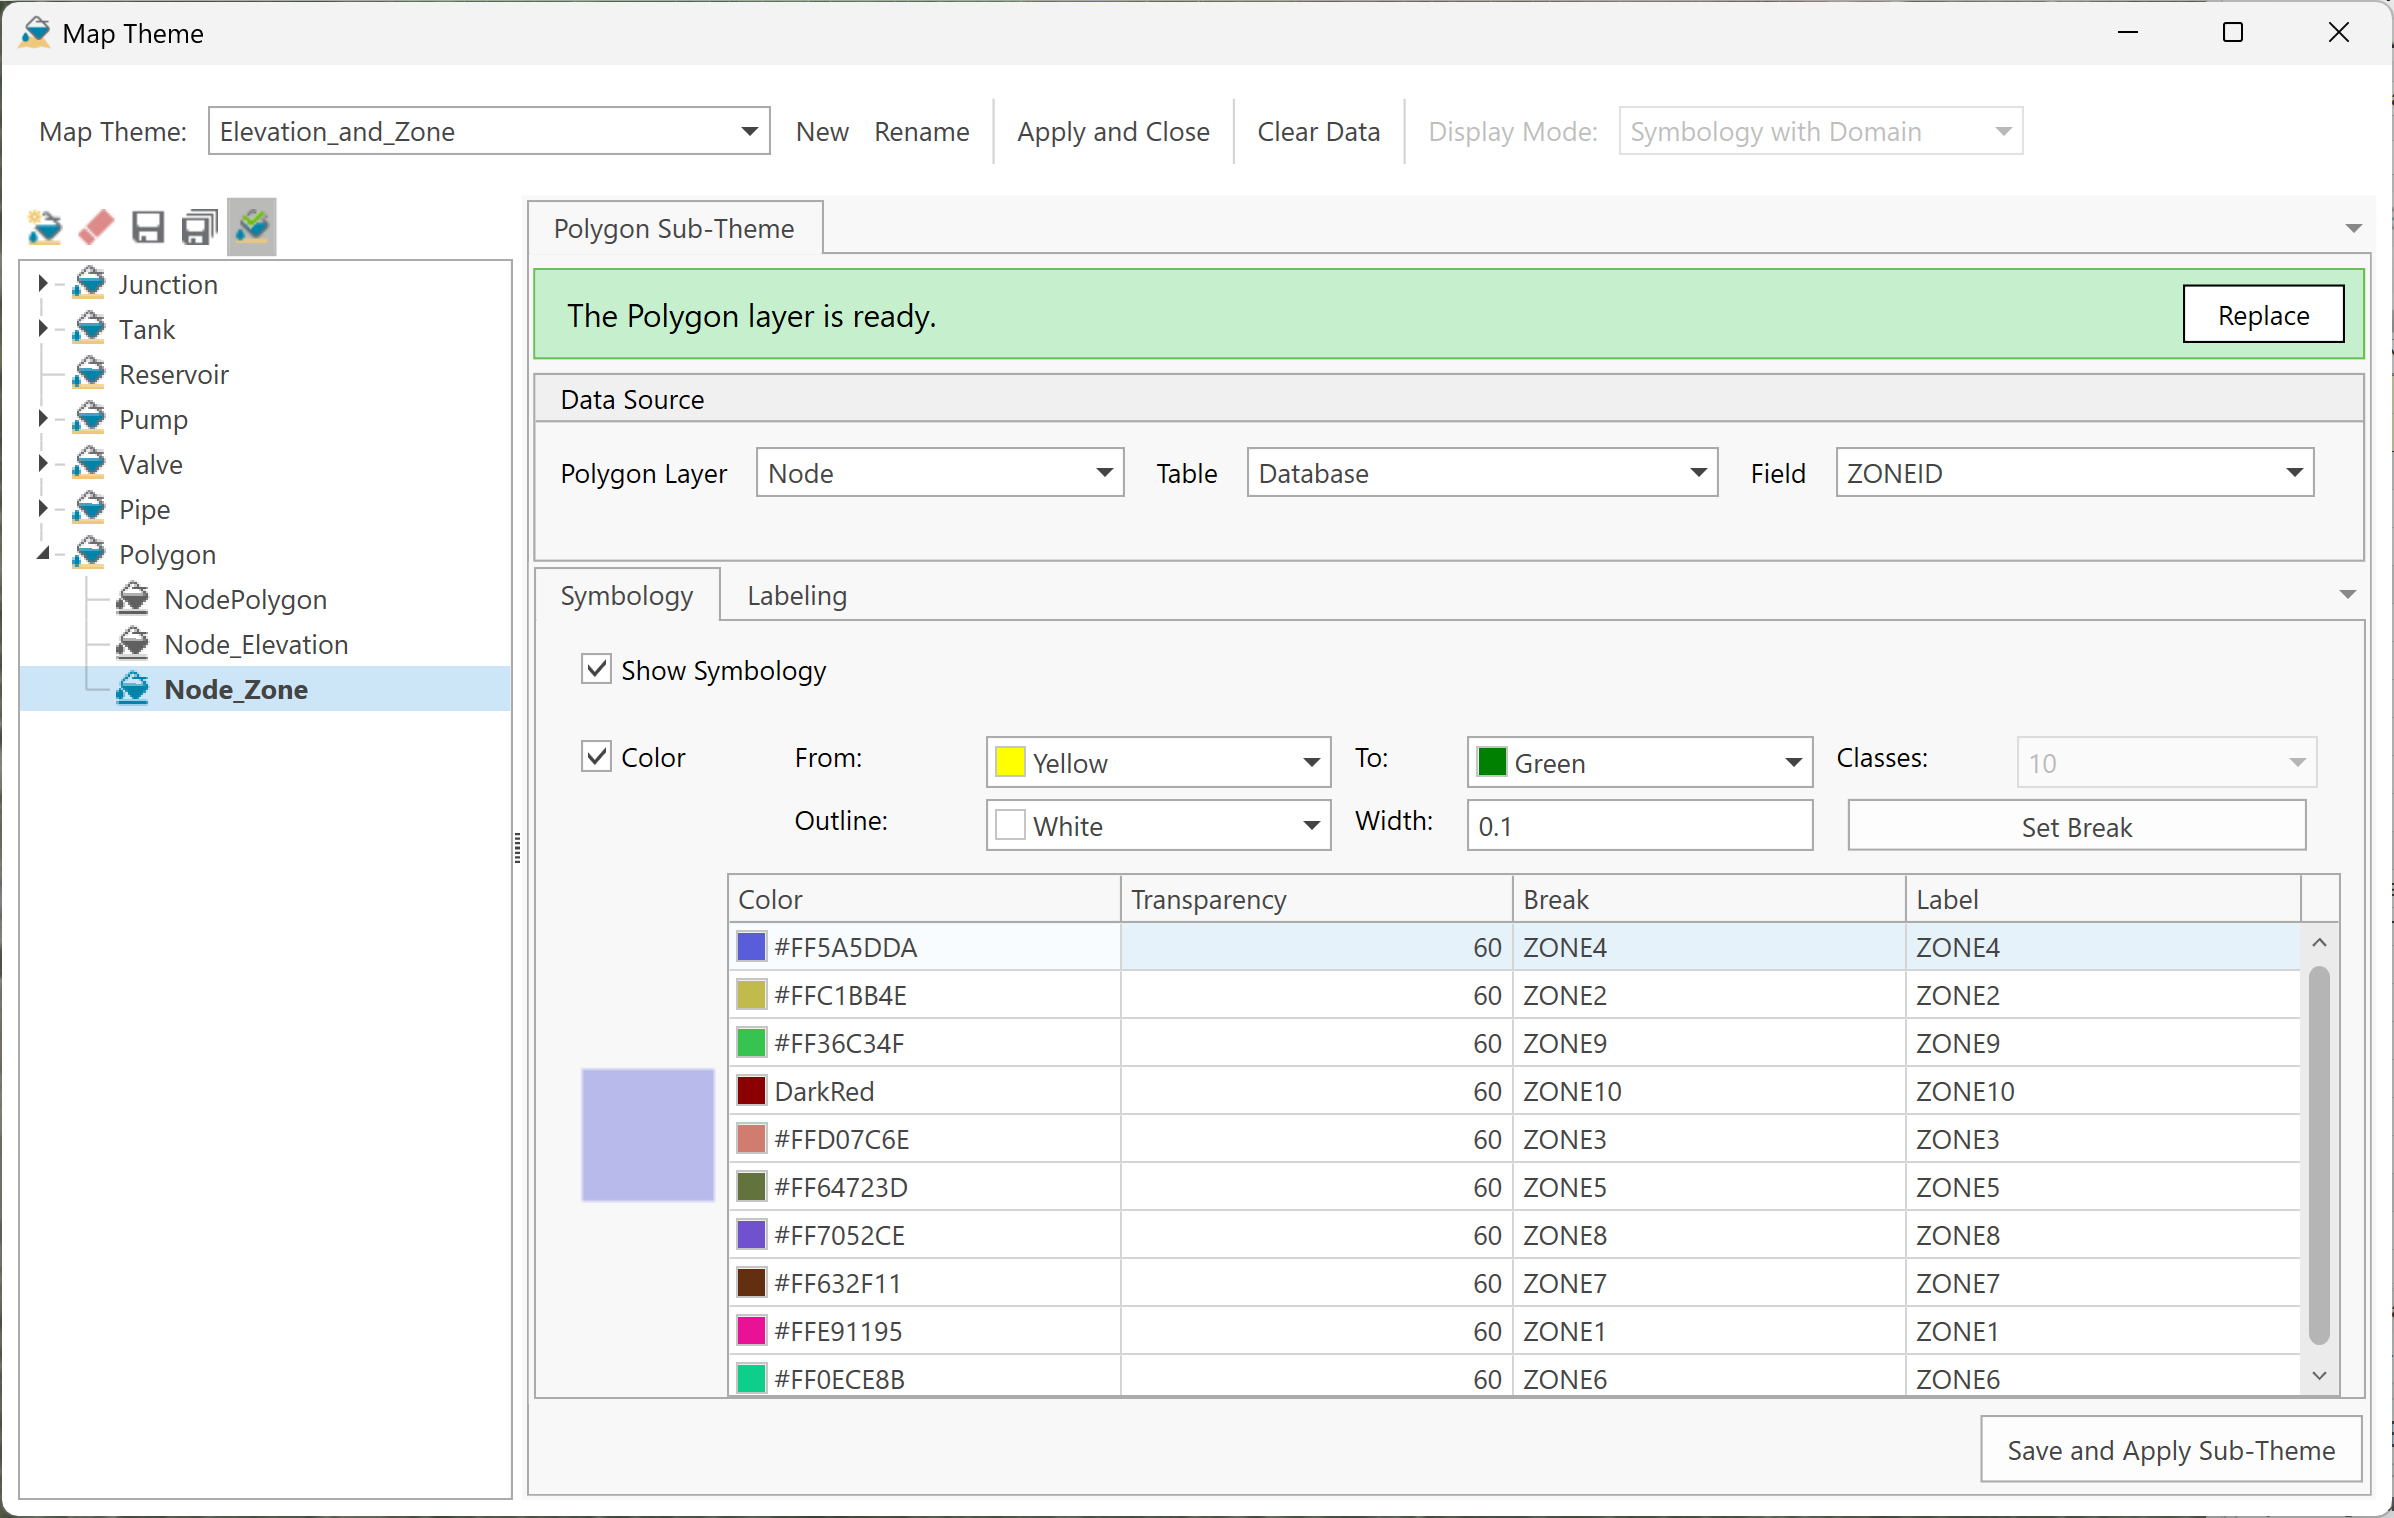
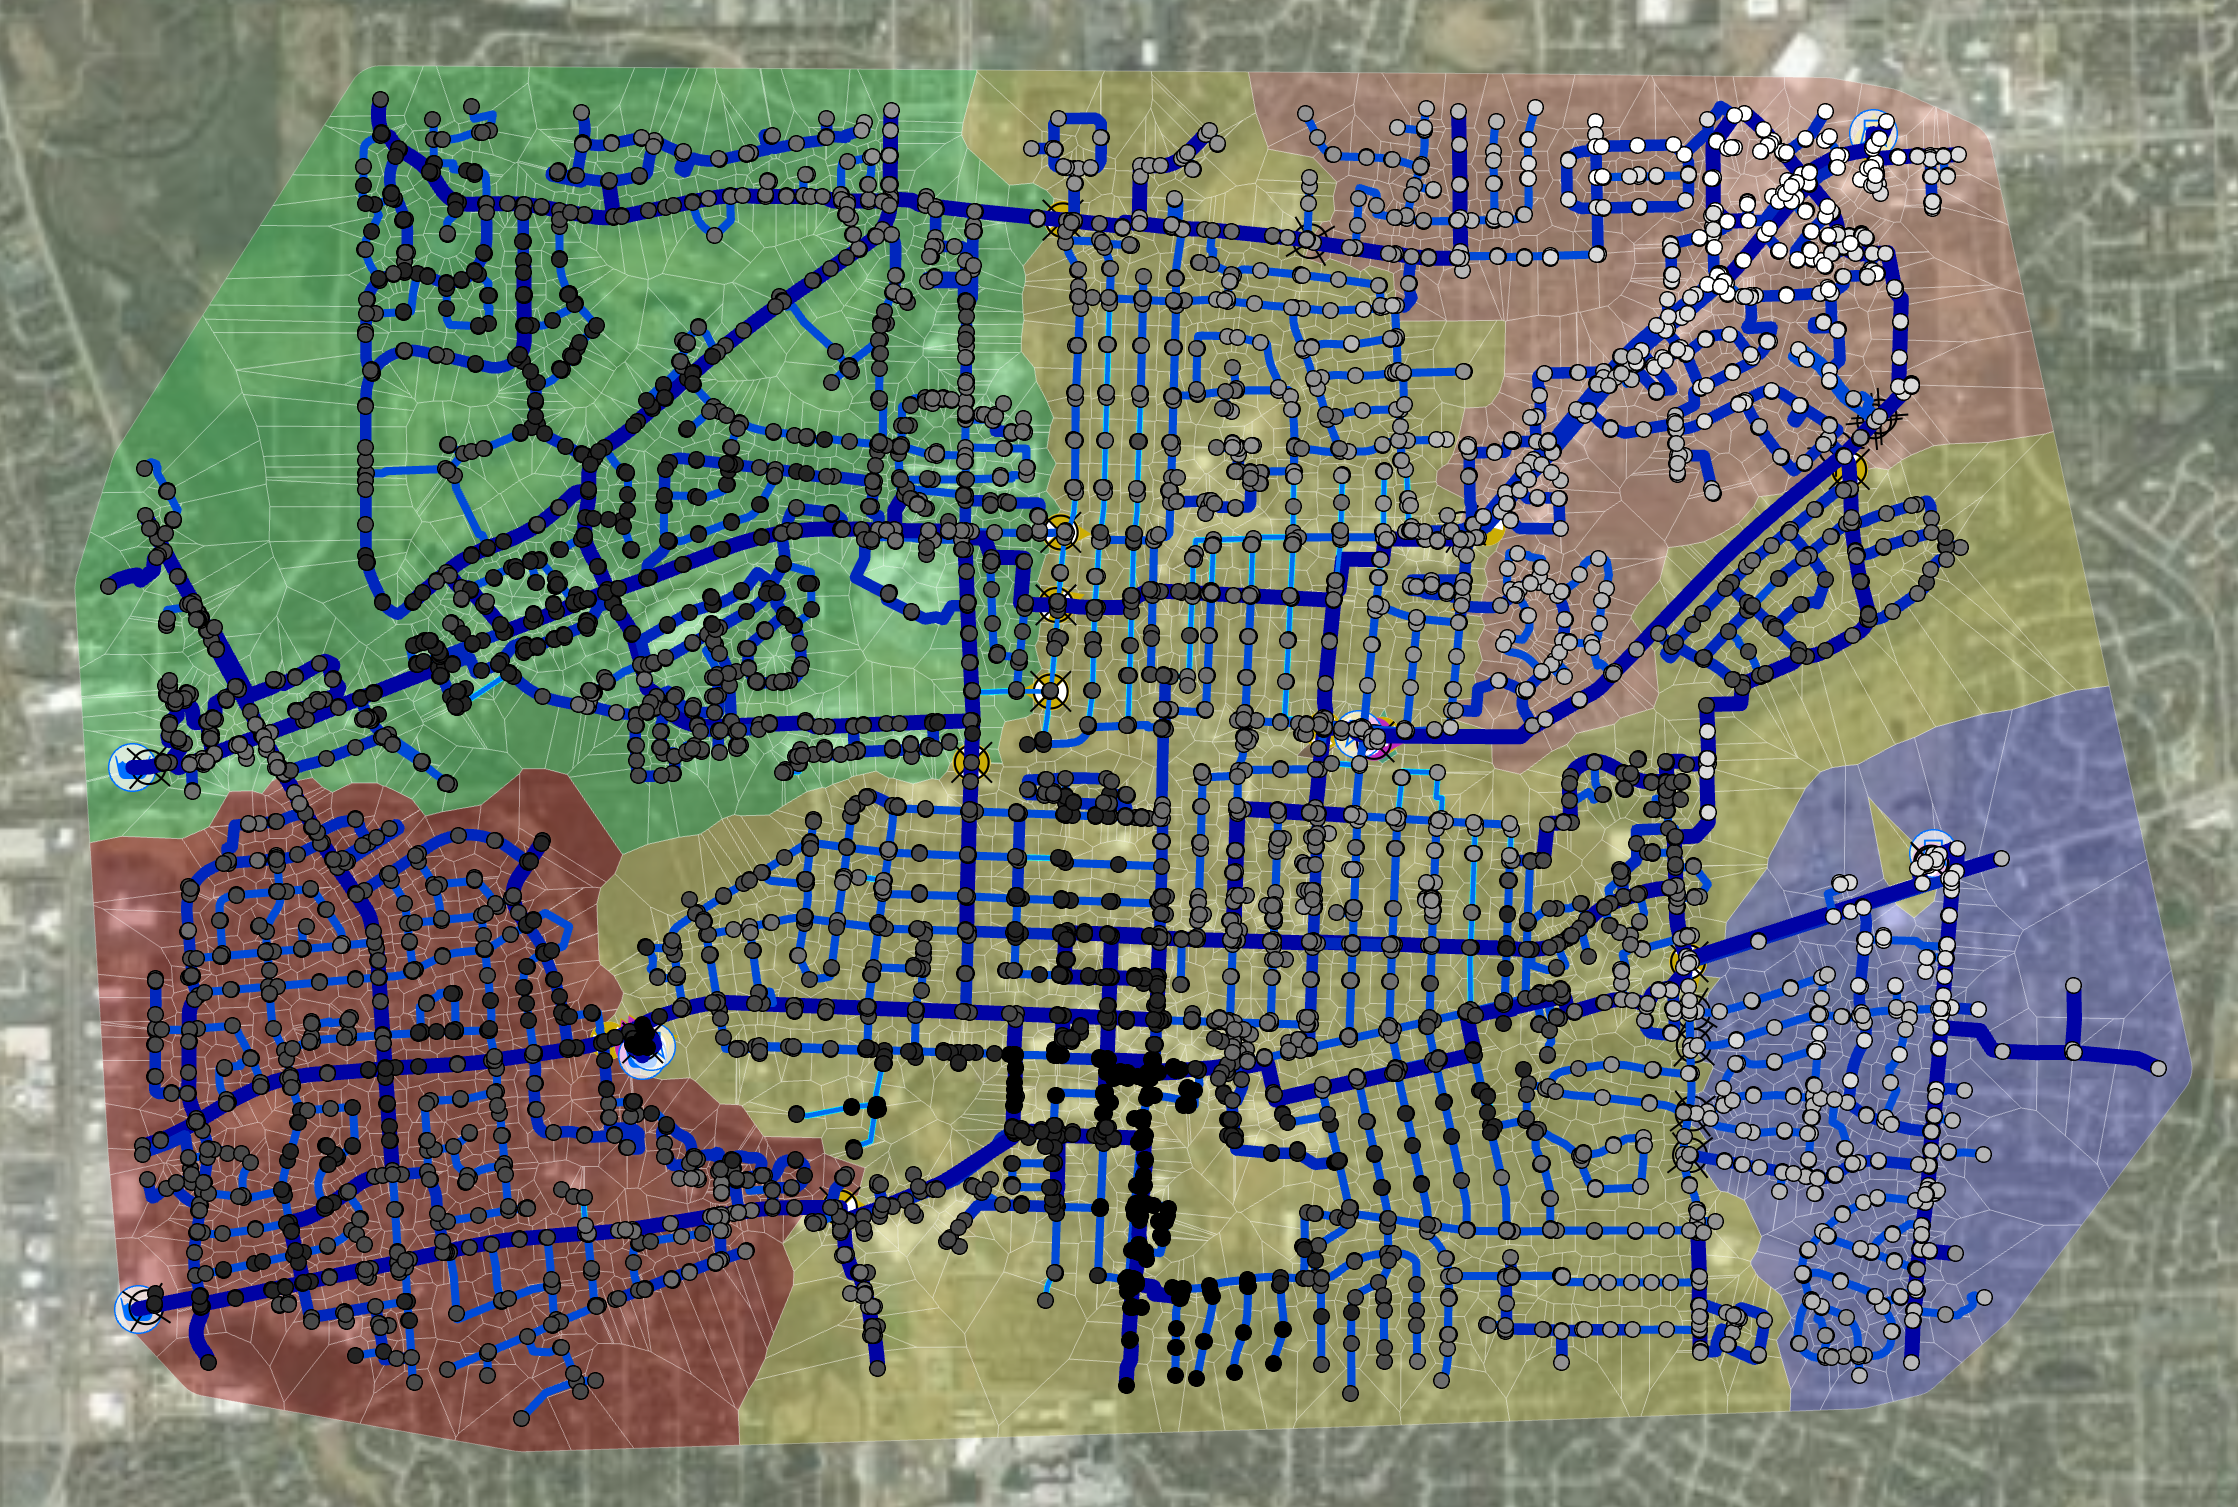
Tip: Use the transparency field and a thin outline to create polygon themes that support viewing the underlying basemap.
Managing and Sharing Map Theme Files
File Conversion
InfoWater Pro projects stored in versions up to 2025.3 had the option to store Map Display objects using .MDS files. When first initializing the model with InfoWater Pro 2025.4 or greater, Map Display objects are converted to Map Themes.
Any existing .MDS files will be preserved for backward compatibility with versions prior to 2025.4.
Sharing Themes Between Projects
The project's …IWDB/MapDisp folder contains a JSON file for each sub-theme, and one "maptheme.json" file that contains the settings of all Themes. This simple file structure enables the following:
- Sharing all themes from one model to another by simply copying and replacing the full MapDisp folder.
- Sharing just map sub-themes between models by copying them from one project folder to another. Each sub-theme is based on a corresponding JSON file named after the sub-theme. This allows you to combine sub-themes together from multiple models. The sub-themes will be recognized when opening the project and can be used in any theme.