Create a Chart from a Report
Create charts and graphs based on the output of a report. Charts can be displayed on your dashboard for a real-time view of report data.
- Go to Advanced Tools > Reports.
- In the Action column of the Reports table, click Edit for the report you want to create a chart for.
- In the report editor, scroll down to the Chart panel.
The sorting you apply to your report changes the ordering in your chart. Typically, the grouping field you use for the X-axis of the chart is your first sort. Also, you can specify a minimum and maximum for the Y-axis range, which adjusts the amount of free space above and below the chart.
- Enable and set up grouping.
- Select aggregates.
- Select a chart type.
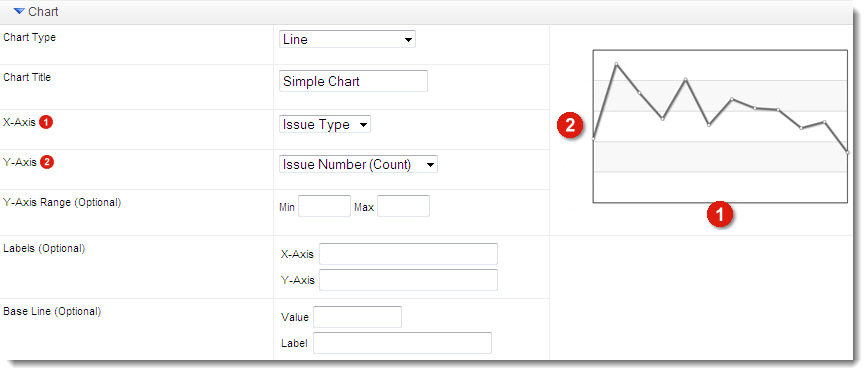
Simple Charts
A simple chart consists of one grouping field on the X-axis and one aggregated field on the Y-axis. Simple chart types include: area, column, doughnut, line, and pie.
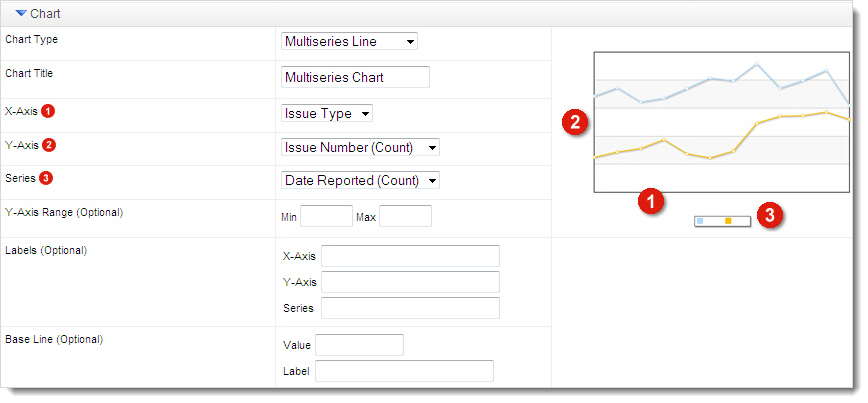
Multiseries Charts
Multiseries charts consist of an X-axis, a Y-axis, and a series. Series are useful for breaking down a dataset, where color distinguishes one series from another. You can populate a series by either a grouping field or an aggregated field. Multiseries chart types include: multiseries area, multiseries column, multiseries line, stacked area, and stacked column.