Create a Report
Create reports and charts to track and manage data on your Fusion Manage site.
Go to Advanced Tools > Reports.
From the drop-down list, select the workspace to use for the report. This is the data source for the report.
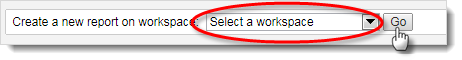
Click Go.
In the General Information panel, enter basic information about the report. Only Report Name is required.
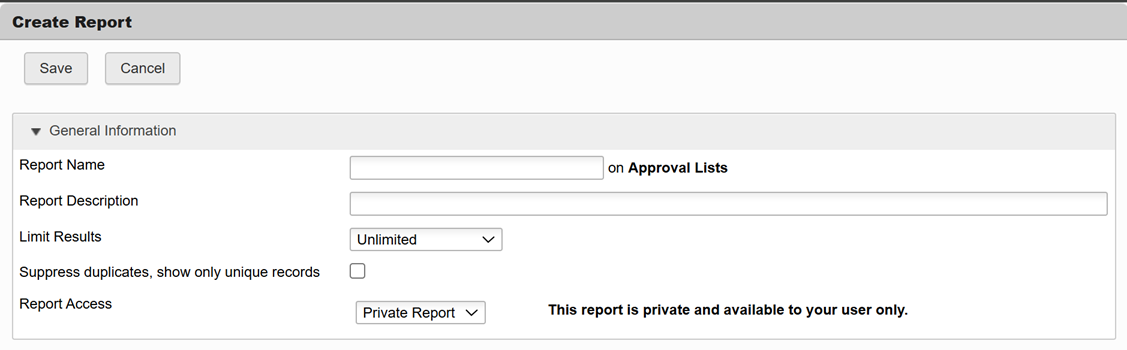
Reports you create are Private by default and only you can access them. If you want other users to access your report, select the type of access from the Report Access drop-down. To give access to all users with permission to view the report workspace, click Shared. To limit access to specific users or user groups, click Public and select the users or groups in the expanded panel below.
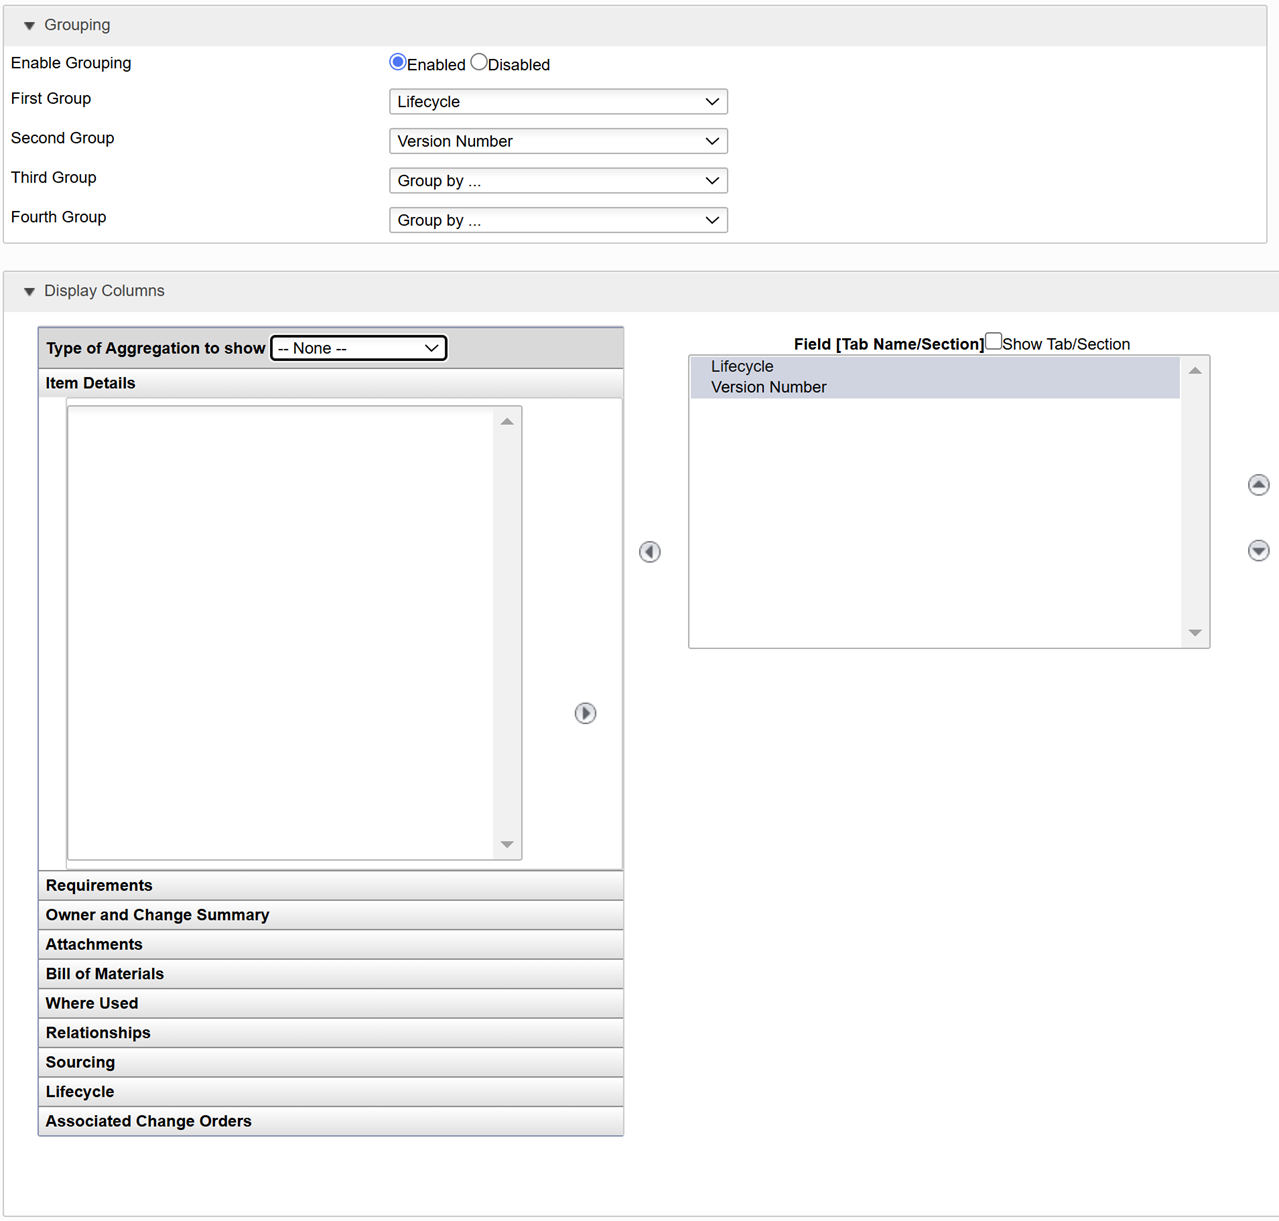
Results grouping is disabled by default. To enable grouping, select Enabled in the Grouping panel and select up to four workspace fields to group on, in order of preference.
 Important:
Enabling grouping in a report disables the option to choose which field columns to display in the report. The workspace fields you select to group on become the columns displayed in the report and cannot be changed.
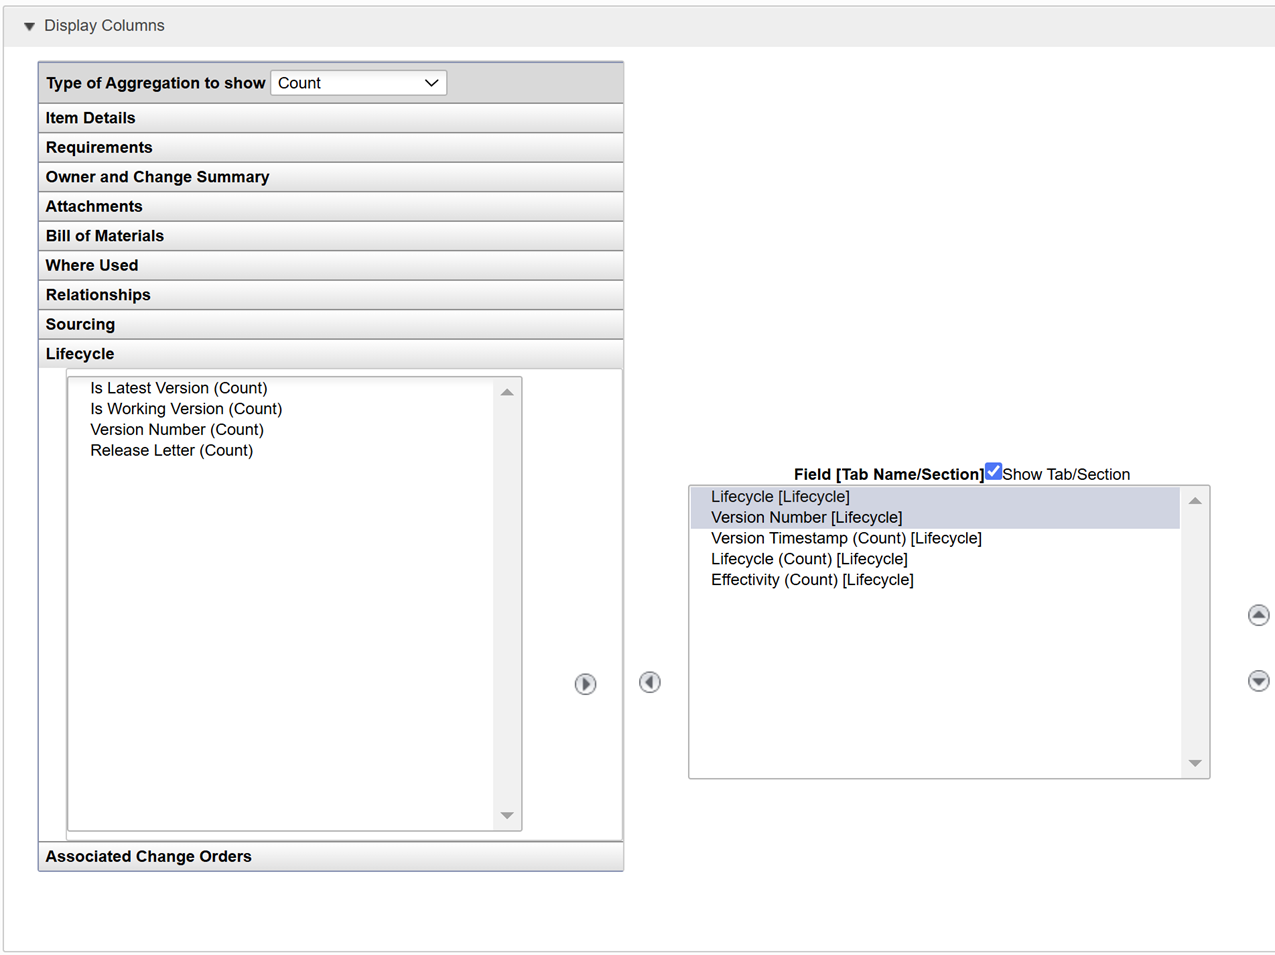
When you enable grouping, you have the option to aggregate results. If you choose to aggregate results, additional workspace fields appear for selection as display columns depending on whether the selected aggregation type is applicable. From the Type of Aggregation to Show drop-down, select an aggregation method:
Total
Average
Minimum
Maximum
Standard Deviation
Count
Important:To create a chart for a report, you must enable grouping AND aggregate results.
For example, consider a report with Lifecycle as the First Group, Version as the Second Group, the type of aggregation is Count and the column to aggregate on is Number. The results are grouped first by Lifecycle and then by Version and the aggregation shown is the number of items for each Lifecycle/Version combination.
In the Display Columns panel, the available columns match the fields in the workspace and are organized by tab.
In the list on the left, double-click a field to display the field as a column in the report.
Use the up and down arrows to change the order of the columns in the report.
Turn on the Show Tab/Section check box to display the tab name with the field name in the column.
In the Filter Rows panel, specify filters to apply to the report results.

- Select the field to filter on and the type of filter to apply, then enter a Value on which to filter.
- To prompt the user for a filter value at the time the report is run, turn on the Edit at Run-Time check box. If a filter value specified in the previous step, it is used as the default value in the run-time prompt.
- To add a filter, click Add Another Filter.
- If you apply more than one filter to a report, select the matching requirement for the results. To require results to match all the filters, click Match All. To require results to match at least one of the filters, click Match Any. To apply advanced matching requirements, click Advanced and enter a Boolean logic formula in the Advanced Filter Formula text box.
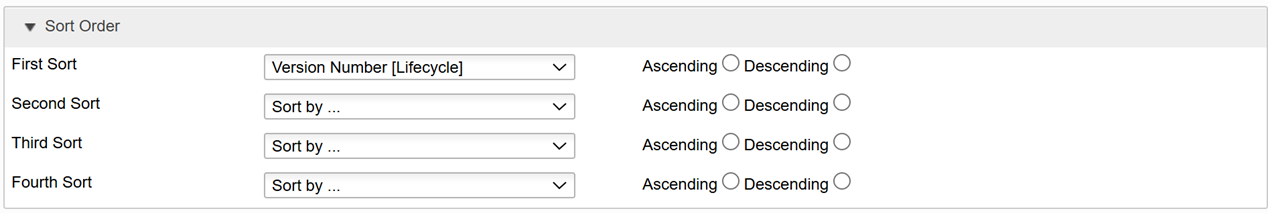
In the Sort Order panel, select one to four columns as First Sort through Fourth Sort. For each column, specify Ascending or Descending order. By default, the first field of the Item Details tab is set as the First Sort.
To use the Chart panel, see Create a Chart from a Report