View a chart
After you create a chart, you can interact with its data, change how values are displayed, print it, or download it.
- From the main menu, go to Advanced Tools > Reports.
- In the Report View column of the chart you want to open, click the Run as chart icon.
The chart opents in an interactive view.
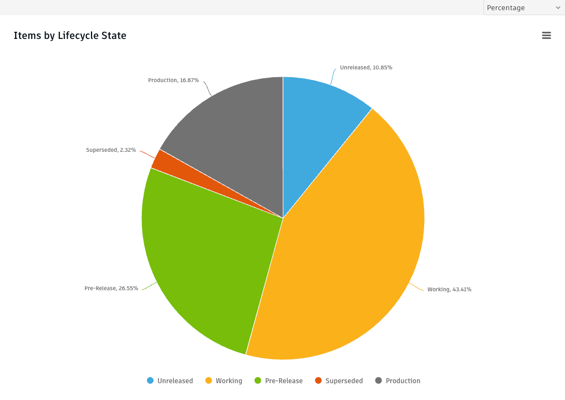
From the chart window, you can:
Change how values are displayed: From the dropdown list in the upper-right corner, select a display option. Available options depend on the chart type.
View chart data: Hover over a chart element to see details about that data point.
Print the chart: Click the Menu icon
 in the upper-right corner, then select Print chart.
Download the chart: Click the Menu icon
, then select one of the following:- Download PNG image
- Download JPEG image
- Download PDF document
- Download SVG vector image