Now that the simulation has run successfully, you will review the results for the piping network. In this step you will determine the operating point of the pump, view the flow direction, and change a displayed result quantity to pressure.
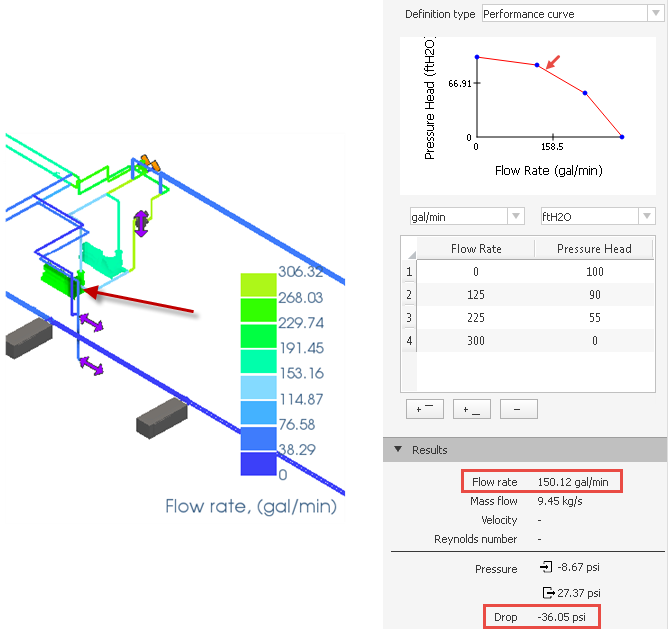
- Select the pump as shown in the image below.
- Check the resultant Flow Rate and Pressure in the Results section.
The resultant pressure drop is a negative value: -36.05 psi, which indicates that the pressure rose across the pump.
- Click
Simulation
 Result Type
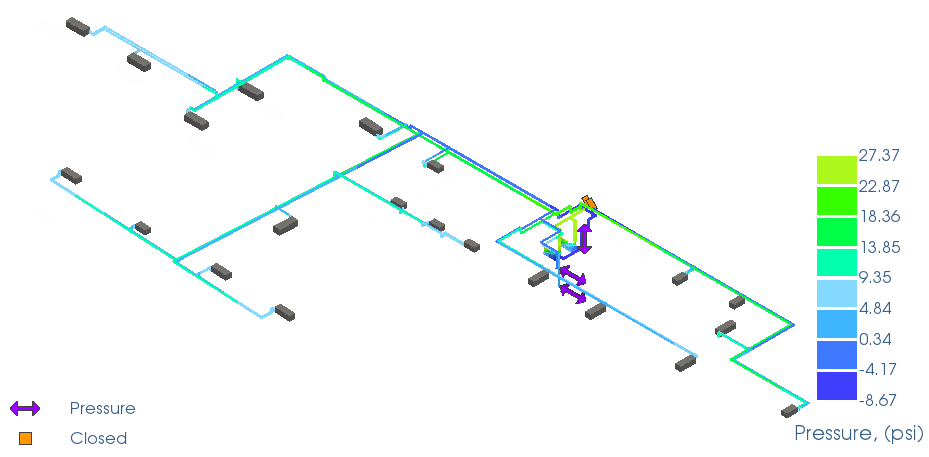
 Pressure to display the pressure results.
- Click
Simulation Result Type
 Flow Rate to go back to the Flow Rate results.
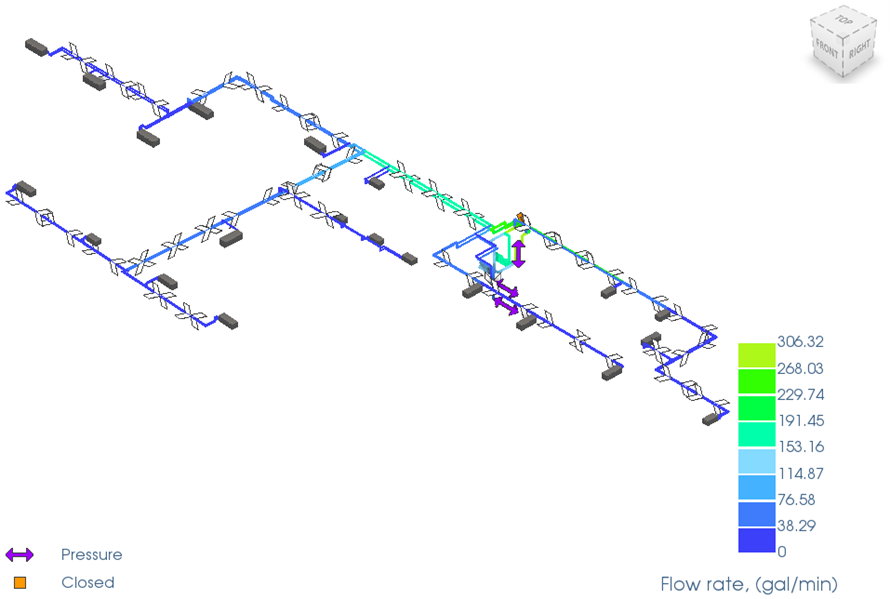
- Click
Simulation
Flow Direction
Show Arrows and
Animate Flow to display the animated flow results.
Note:
- The animated arrows show the direction and velocity of the flow.
- The animated velocity is proportional to the actual flow velocity specified for elements.