
Cash Flow Forecasting
Access a project-level cash flow analysis and quickly visualize the difference between planned, actual, and forecast with built-in dynamic charts.
When all budget line items are forecasted, you can go to the Cash Flow tab to see a project-level cash flow analysis and the planned and actual forecast. Based on that, you can investigate details. The Cash Flow tab is a centralized place to create and manage all cash flow distributions.
Quick Navigation
- First time here? Start with Create a Distribution Item to set up your cash flow analysis.
- Need to make adjustments? Jump to Create Forecast Adjustments or Automated Forecast Adjustments.
- Working with quantities? See Quantity Distribution for time-based forecasting.
- Managing existing data? Go to Update a Distribution or Navigate the Cash Flow Table.
In this article:
- Set Preferred Forecast Period
- Create a Distribution Item
- Create a Distribution
- Automated Forecast Adjustments
- Create Forecast Adjustments
- Quantity Distribution
- Update a Distribution
- Clear a Distribution
- Delete a Distribution Item
- Distribution Item in the Collaborative Workflow
- Navigate the Cash Flow Table
- Related Articles
Set Preferred Forecast Period
Within the Settings tool, project administrators can set preferred forecast periods; weekly or monthly. Once a forecast distribution is created on any budget item this setting cannot be changed.
See the Forecast Setting to learn more.
Create a Distribution Item
You can create distribution items to see how your budget is performing at a project level with four built-in curves.
To create a distribution item:
Go to the Cash Flow tab within the Forecast tool.
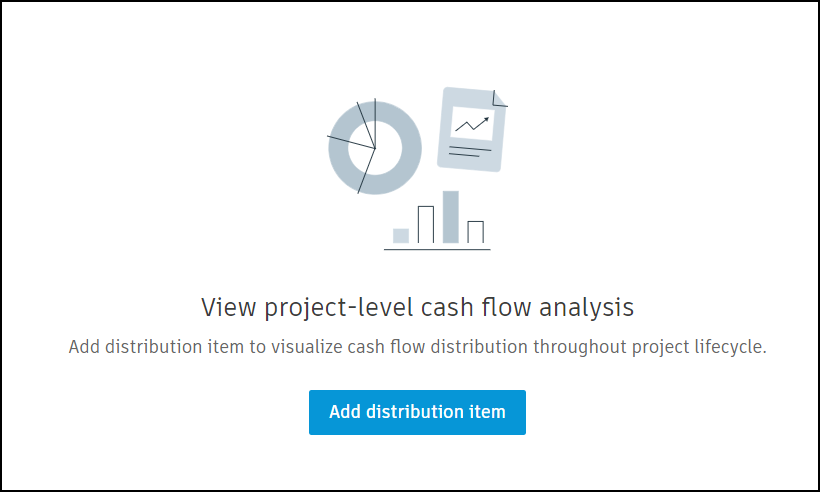
If there are no distribution items created yet, you'll see Add distribution item there:
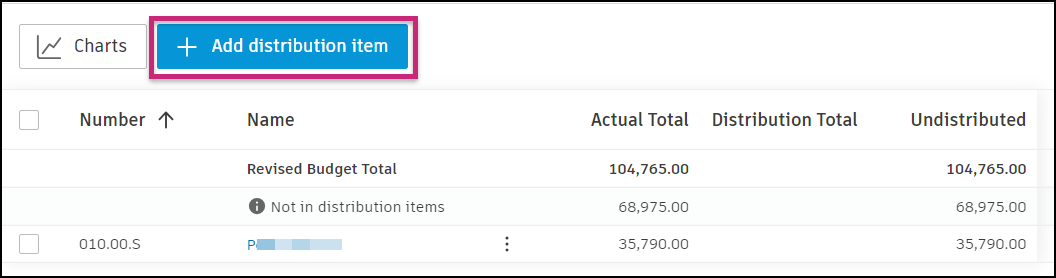
However, if there are existing items, the Add distribution item button shows at the top:
Now you can choose what will be the base for a distribution item: Budget, Budget code segment, or Contract.

Select distribution items and click Add.
Tip: You may need a permission to view items on those lists. Contact a project administrator to obtain permissions. For the Budget tab, you'll need View All or Full Control. For the Contract tab, you'll need Collaborate, View All, or Full Control. Learn more about Cost Management's permissions.
Distribution items are added to the Revised Budget list, the detailed view of the Cash Flow tab. In the Cost & Time tab, you can connect budgets to schedule tasks, but actual distribution is done in the cash flow view. To create a distribution, you need to have created scheduled tasks.
Create a Distribution
After creating a schedule task and a distribution item, you can create cash flow distribution to see a project-level cash flow analysis and the planned and actual forecast. To do so:
Go to the Cash Flow tab within the Forecast tool.
Open the distribution item list view of Revised Budget or Forecast Final Cost. In our scenario, we clicked Revised Budget. The detailed view of Revised Budget opens. If project administrator allows budget forecasting, here you'll see Forecast Final Budget.

You'll see the list of distribution items. Click the More menu
 next to the one you want to create a distribution.
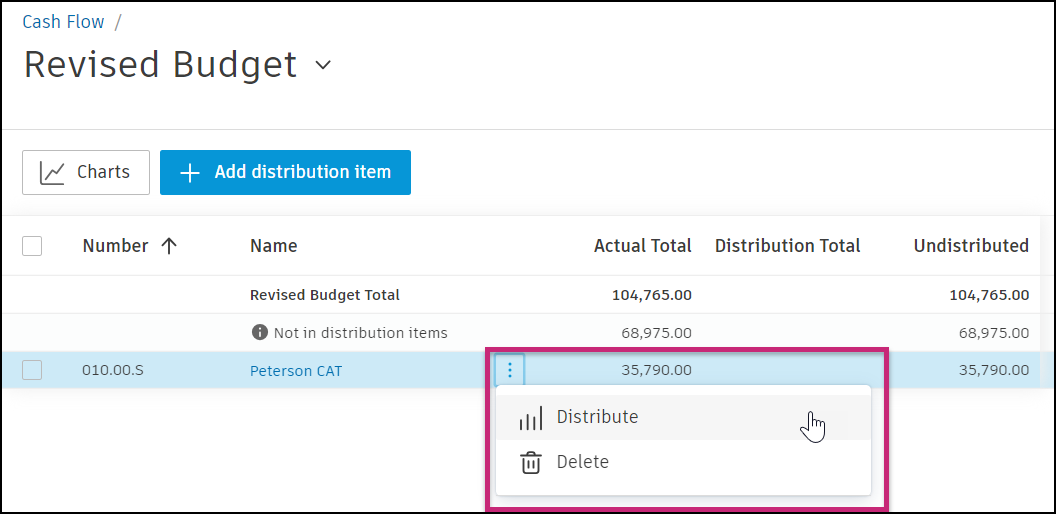
Choose distribution start and end dates. Choose the style of the cash flow curve.
Note: Date range resources are available for distribution in the cash flow view. You can view quantities per period as an alternative to dollars, and add resources bidirectionally between distribution items and cash flow views. See Quantity Distribution to learn more. To configure date range resource frequency settings, see Date Range Based Resources.
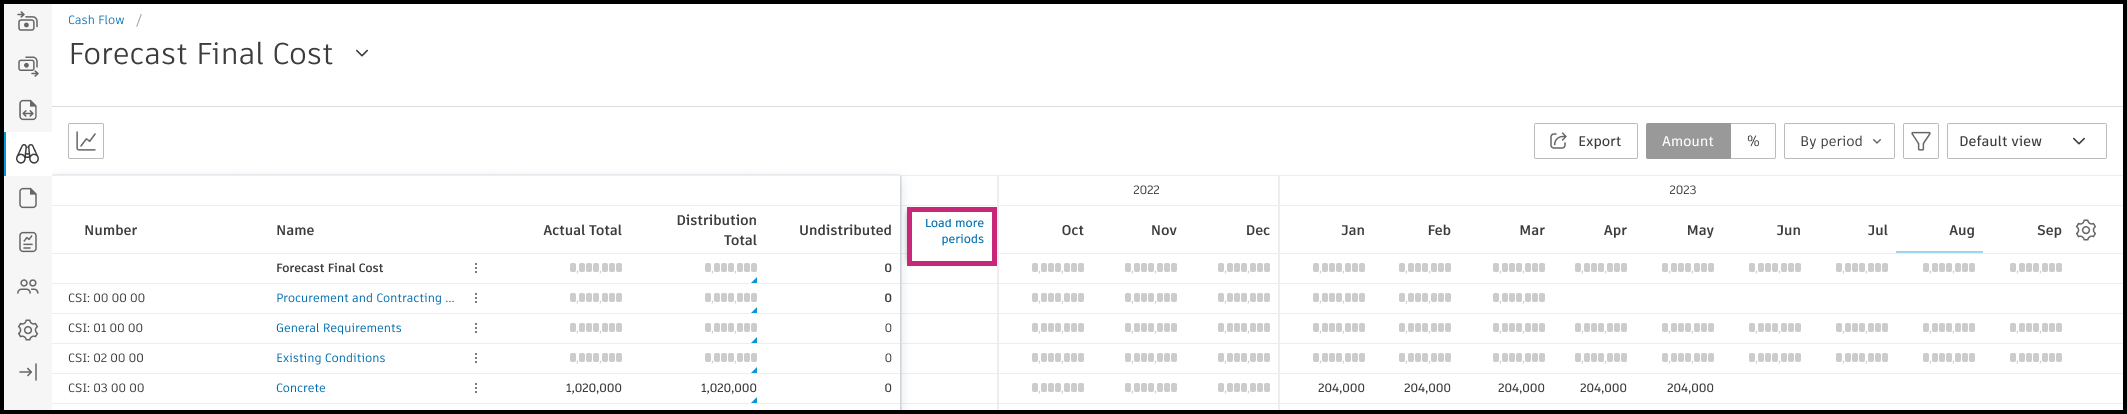
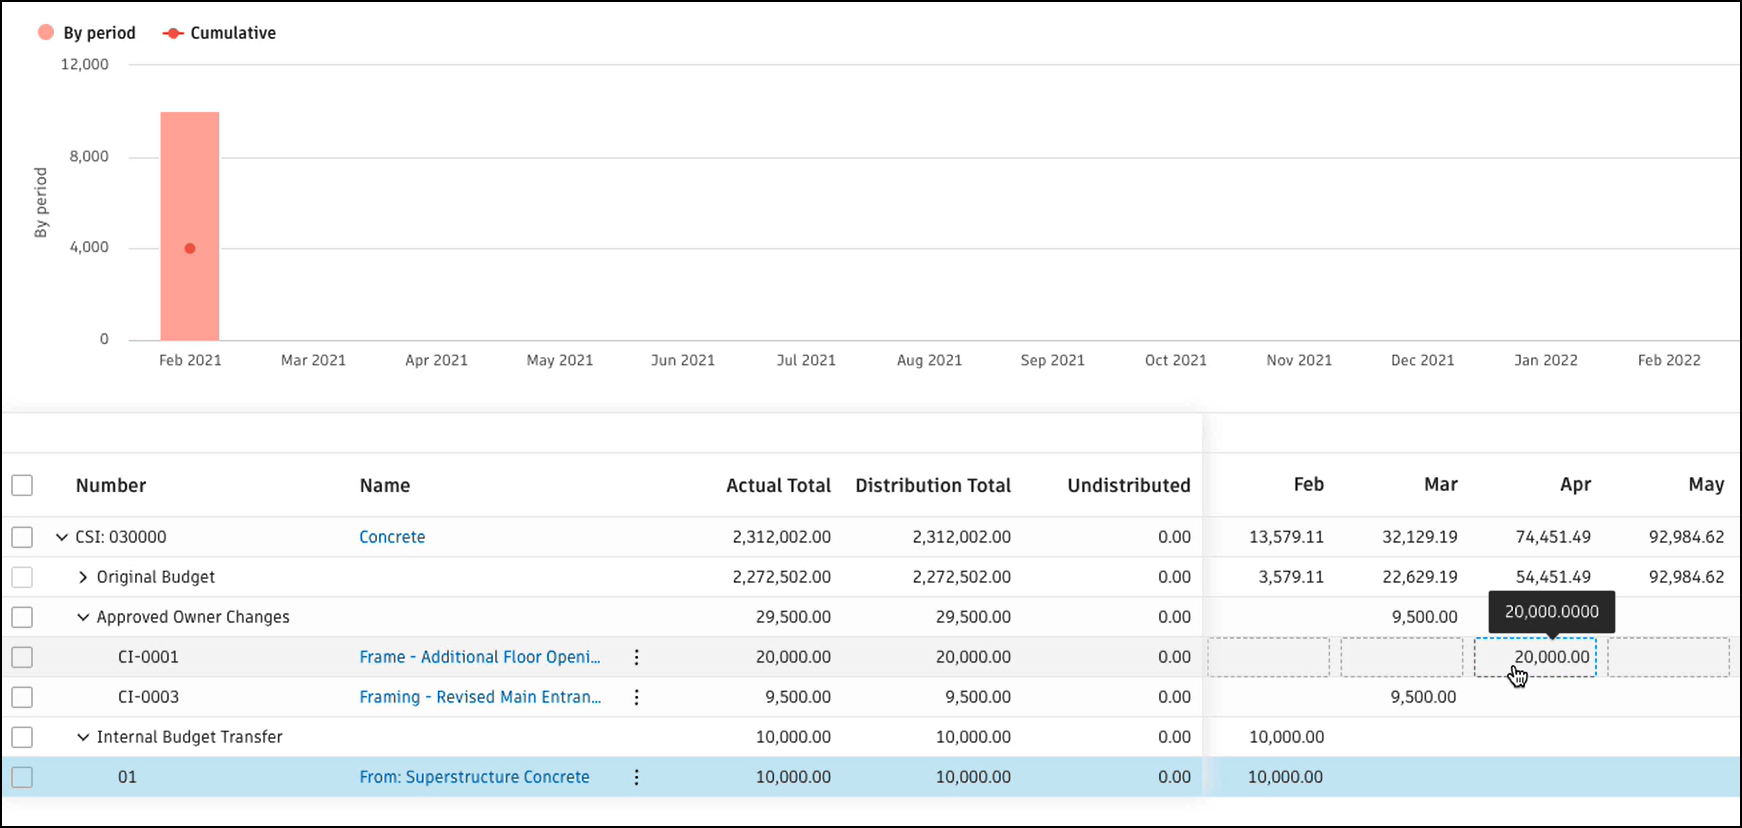
The distribution is created. You'll see the table with created distribution, divided into months and years, and you can load more periods when available.
You can override dates if preferred.
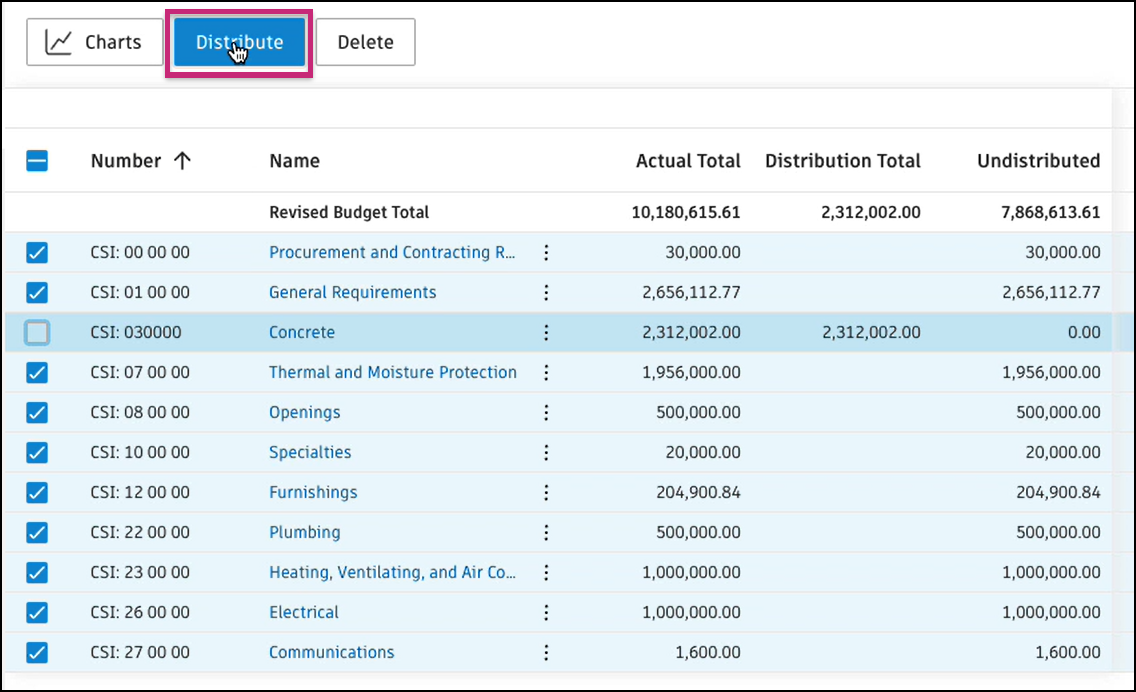
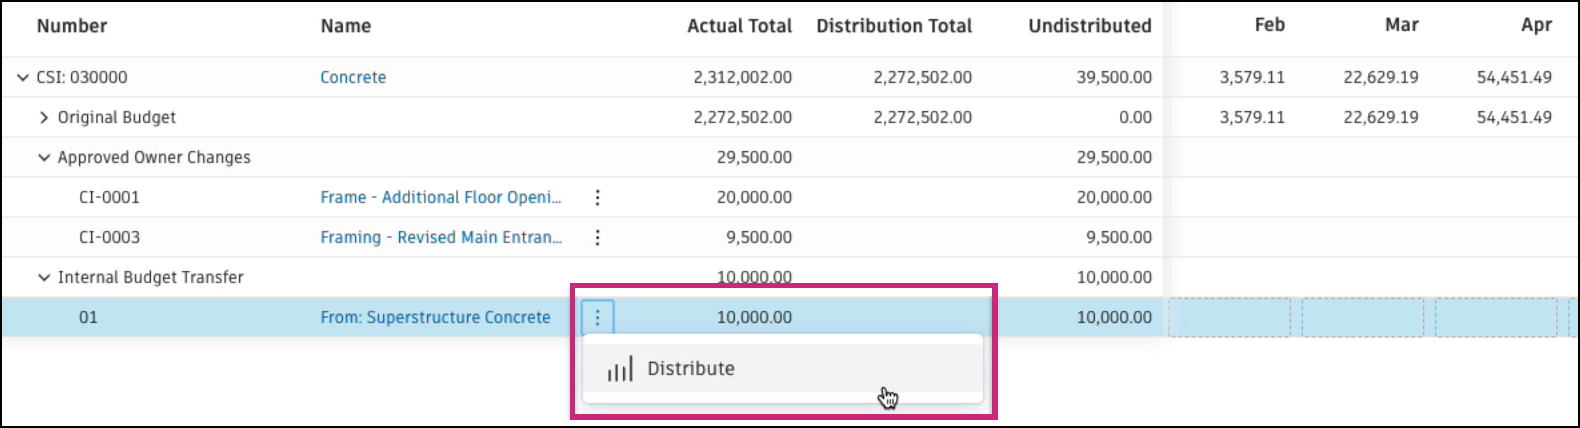
Create distribution from multiple distribution items
To create a distribution based on multiple distribution items, select the distribution items and click Distribute at the top of the page.
Automated Forecast Adjustments
You can redistribute your forecast at any time, whether you have actual costs or not. This flexibility lets you adjust your cash flow forecast as your project evolves.
When you have actual costs: If the value of a specific period on the Forecast Final Cost (or Forecast Final Budget) curve doesn't match the corresponding period on the Actual Cost curve, an indicator will appear in the distribution item list view.

Starting redistribution: Select Redistribute from the context menu to open the redistribution dialog.
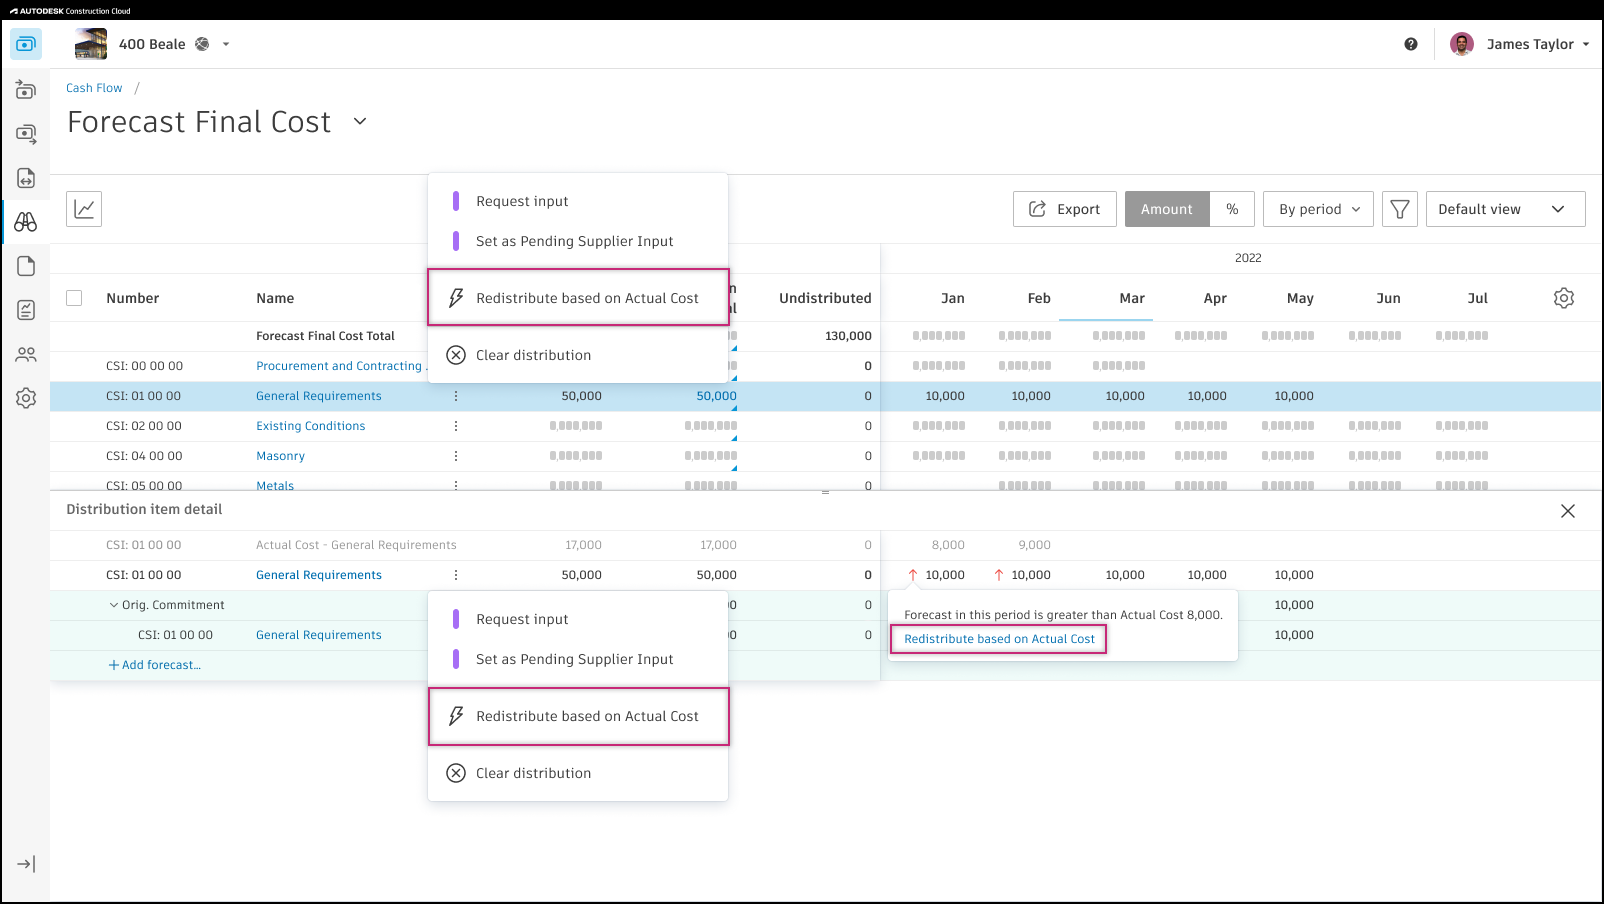
Redistribution Options
The redistribution dialog shows different options depending on whether you have actual costs:
Use current actual cost for past periods toggle:
- Toggle ON: Match past periods to actual costs (when available), then redistribute remaining periods
- Toggle OFF: Ignore actual costs and redistribute all periods using forecast calculations
When the toggle is ON and you have actual costs, you'll see three options for handling remaining periods:
- Keep the same Forecast Final Cost: Evenly distribute the variance across remaining periods
- Calculate new Forecast Final Cost: Use average cost, manual trending, or % complete to recalculate
- Edit each period manually: Manually adjust each remaining period
How Different Scenarios Work
| Scenario | What Happens |
| No actual costs exist | The "Use current actual cost for past periods" toggle is unavailable. You redistribute all periods using one of the calculation methods (average cost, manual trending, or % complete) or edit each period manually. |
| Some actuals exist, but not all periods are final |
|
| All periods are final | All periods match actual costs. The redistribution adjusts the distribution to align with actual spending patterns. |
Keep the Same Forecast Final Cost
When you select this option and have actual costs:
- Past periods are adjusted to match the actual cost (the current period is not included in these adjustments)
- The variance resulting from adjusting past periods is evenly spread across the remaining periods
When you don't have actual costs or toggle OFF "Use current actual cost for past periods":
- The system redistributes all periods while keeping the same total forecast final cost
After clicking Redistribute, the distribution item line becomes editable with Cancel and Confirm buttons at the right end of the row.
Calculate New Forecast Final Cost
This option recalculates the forecast final cost based on one of three methods:
Calculate from Average Cost
- Average cost is determined by the sum of actual costs from past periods, divided by the number of these periods
- If no actuals exist, the calculation uses the distributed amounts from past periods
Calculate from Manual Trending Cost
- When actual costs exist, this uses the actual cost from the last past period
- When no actuals exist, this uses the distributed amount from the last past period
Calculate from % Complete
- With actuals: The new final cost is determined by dividing the actual cost by the percentage complete
- Without actuals: The calculation is based on distributed amounts
- A multiplier (calculated by dividing the new remaining cost by the current remaining cost) is applied to each remaining period
Edit Each Period Manually
Select this option to manually adjust the distribution for each period:
- The remaining periods retain their current values but can be modified as needed
- Open the distribution detailed view to edit values in relevant periods
- This option is useful when you need precise control over specific period amounts
Tips for Redistribution
General guidelines:
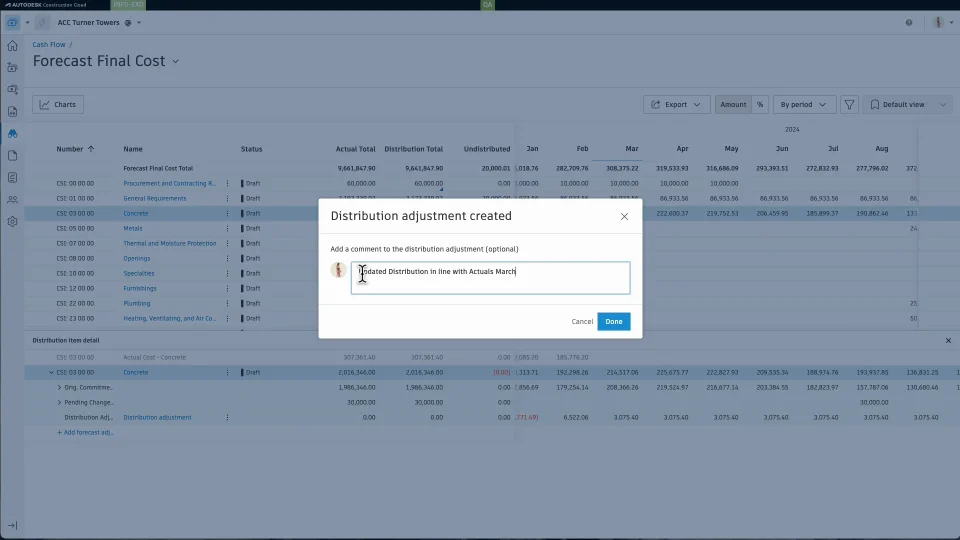
- The distribution adjustment is uneditable but can be deleted
- A dialog box allows for an optional comment on the distribution adjustment. No email notifications will be sent for this comment
- Distribution adjustment will not be created under any budget and is only visible in cash flow
- Adding or deleting a period will not affect the distribution adjustment
Working with periods:
- You can extend the last period by selecting "Add new period" in the end period drop-down. Extended periods need to be manually selected as the end period
- If redistributing with the extended end period, the extended periods will be created. Otherwise, they won't be created
- You can move the last period earlier by selecting an earlier period in the end period drop-down. Periods after the new last period will be adjusted to 0.00 in the editing state
- Distribution adjustments are created after confirming the redistribution
Date range resources:
- The "Use current actual cost for past periods" toggle works with date range resources
- When the current period is before the first period or there's no actual cost, the toggle is off and disabled
Here is a demo of Automated Forecast Adjustments in action:
Create Forecast Adjustments
Apart from automated forecast adjustments you can also create adjustments manually.
In our scenario, we're adjusting Forecast Final Cost to New Traveling PM Budget. To do so:
Click the blue triangle in the Distribution Total.
Choose Add forecast adjustment in the flyout panel.

In the new window, choose a budget to add forecast adjustment to.
Click Add.
Name the new adjustment and approve it.

Now, open the distribution item detail view of New Traveling PM Budget and edit values in relevant periods.
You can add forecast adjustments in the same way in Revised Budget (or Forecast Final Budget, when budget forecasting is on) and Forecast Final Cost.
Quantity Distribution
Use Quantity Distribution to track your cash flow with quantities and units (hours, days, weeks) alongside dollar amounts. This helps you manage labor budgets and time-based work by showing both the amount of work and when it will happen.
Example Scenario: When you create budgets using quantities and unit costs (for example, 100 hours × $50/hour = $5,000), the system only tracks the total dollar amount ($5,000) and loses the original quantity information (100 hours).
The Solution: Quantity distribution preserves both the dollar amounts and the original quantities, allowing you to:
- Plan work schedules based on available hours/days
- Forecast resource needs more accurately
- Adjust timelines by changing quantities rather than just dollar amounts
Viewing quantity distribution
To work with quantity distribution, open distribution item list view:
Then you can:
Toggle views: Switch between "Amount" and "Input Qty" views using the toggle button.
- Amount view: Shows dollar values and percentages.
- Input Qty view: Shows quantities and percentages.
Work with the Unit column: When in quantity view, you'll see a "Unit" column showing:
- Budget items: The budget's original unit (hours, days, and more).
- Segment/Contract items: Shows hours.

How quantity distribution works
This feature is most valuable for labor and other time-based work. Try to use consistent time units within similar types of work. Update both quantities and amounts as your project progresses. Pay attention to unit costs when adjusting to ensure they remain realistic.
Key features:
Forecast adjustments. When adding forecast adjustments:
- Enter a unit cost (for example, $75/hour).
- The system calculates quantities automatically based on your dollar adjustments.
- This unit cost applies to all time periods in the adjustment.
Redistribute based on actual cost: When you redistribute amounts based on actual costs, the system also redistributes quantities proportionally, keeping your quantity forecasts aligned with actual progress.
Modify quantity and unit cost per period after forecast adjustment was added. To do so, in the consolidated view:
Click Edit input qty & unit cost.

Edit distribution.

Default units and how to change them
The system automatically selects appropriate units:
- Time-based budgets: Uses the budget's original unit (hr, d, wk, mo)
- Nontime-based budgets: Defaults to hours (hr)
- Segment/Contract distributions: Uses hours (hr)
For time-based distributions, you can switch between different time units: hr (hours), d (days), wk (weeks), mo (months).
The system automatically converts quantities when you change units (for example, 40 hours becomes 1 week).
Update a Distribution
An Undistributed column advises of any differences between the amount in the budget view and the currently distributed. Selecting the More menu next to the item with an orange triangle allows you to add in undistributed items for change orders or transfers, so they can be distributed separately from the original work.
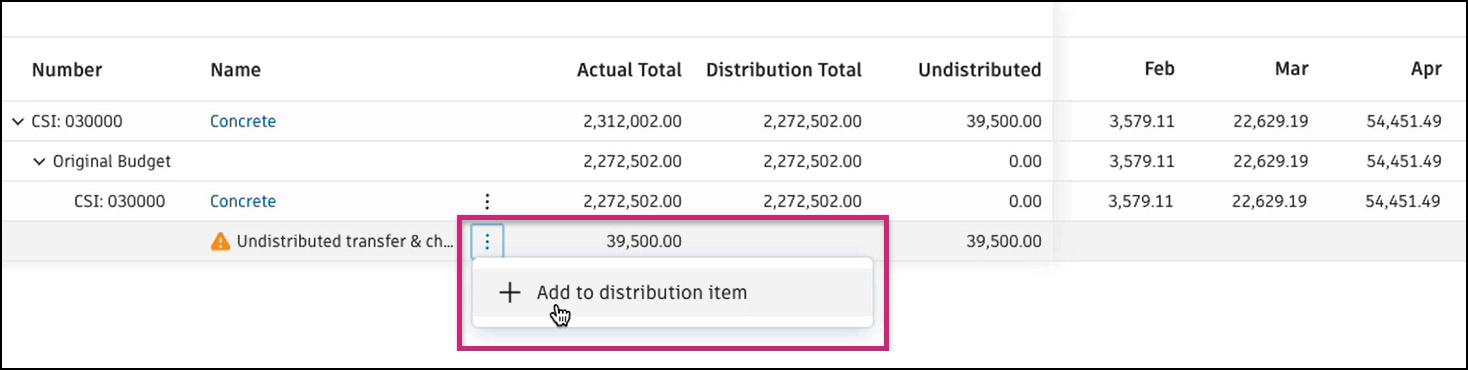
After adding to the distribution item, you'll see the detailed view:
You can distribute those items using the predefined curves or manually.
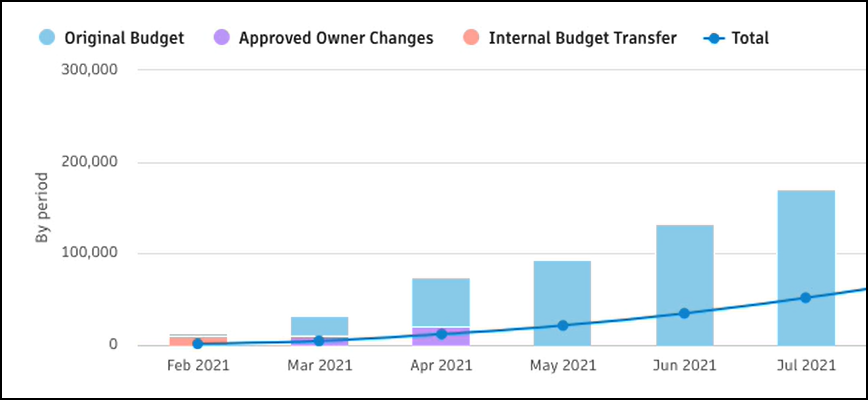
Approved Owner Changes and Internal Budget Transfer amounts are shown in a different color in the chart.
Clear a Distribution
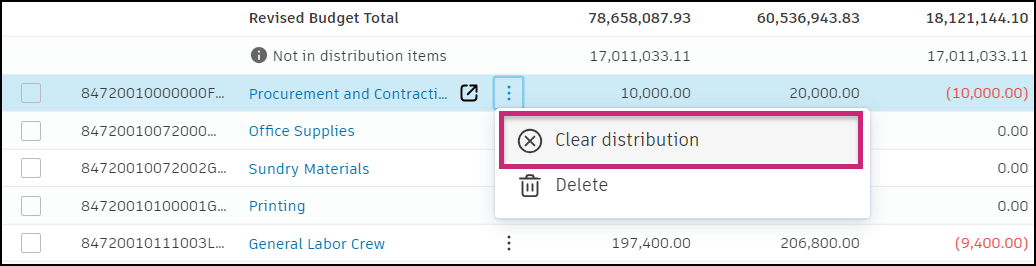
To clear a distribution, click the More menu next to a distribution item and select Clear distribution.
Delete a Distribution Item
To delete a distribution item, click the More menu and then select Delete. To delete more than one distribution item, select boxes next to items you want to delete, and then click Delete.
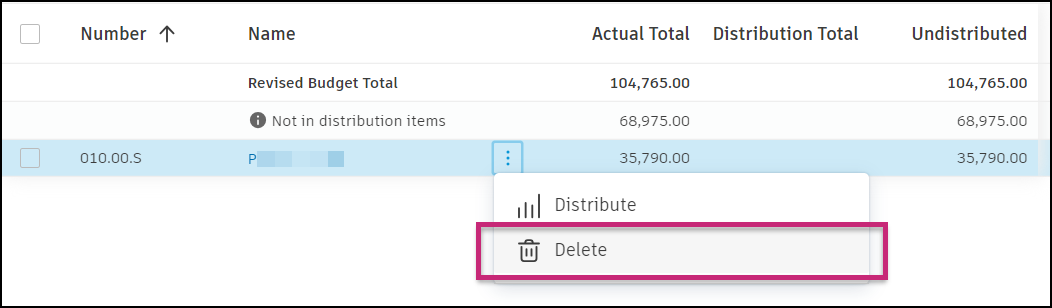
In both cases, you'll be prompted to confirm the action.
Distribution Item in the Collaborative Workflow
The collaborative functionality in the Forecast tool allows users to send distribution items to suppliers and ask for their input.
Learn more about the Cash Flow Collaborative Workflow.
Learn how to:
- Set collaboration in Forecast tool
- Send distribution items for review
- How suppliers can participate and submit their input.
Navigate the Cash Flow Table
Teams can access a project-level cash flow analysis to easily visualize the cash flow distribution throughout the project lifecycle. This real-time summary enables teams to see planned actual and forecast quickly with all the details, when necessary. To access the Cash Flow table, open the Forecast tool.
To display the built-in dynamic time-versus-money chart, select the ![]() icon. Then, you can:
icon. Then, you can:
- Toggle between amount and percent.
- Use the drop-down list to select By Period or Cumulative to change the view of the chart.
- Use the settings icon
 to display Cumulative, by Period, or both.
 - Select one of the legend items (Revised Budget, Work Completed, Actual Cost, or Forecast Final Cost). Clicking each name reduces the chart to only show the selected data. To get back to the project summary with all four legends active, select one from the table view. You can now select the Charts icon near Project Summary to enable the default view.
- Hover over a period to get a list view of the details.

You can manipulate the Cash Flow table by using the ![]() icon:
icon:
- Check or clear columns' checkboxes to change their visibility.
- Use the
 icon to drag columns to a different location.
 - Use the
 icons to snap a column to the left or right.
You can also see more details by selecting the ![]() icon that appears in the table when hovering over a line:
icon that appears in the table when hovering over a line:
The view of the budget for the specific column opens. Add distribution items and create cash flow distributions from this view. Click budget items with the ![]() icon to see a more detailed forecast. Periods are divided into months and years, with extra periods available to load when needed.
icon to see a more detailed forecast. Periods are divided into months and years, with extra periods available to load when needed.

Cash flow periods are dynamic. Therefore, period column position and visibility cannot be saved in cash flow saved views. Only the following columns will be kept in saved views:
- Number
- Name
- Actual Total
- Distribution Total
- Undistributed
Consolidated view
You can view and edit the details of a distribution item on the list, and also see the cash flow context of other distribution items, by displaying these details in a subtable.
To display distribution item details in a subtable in the list view:
Select any Distribution Total that has a blue triangle indicator to expand the subtable.
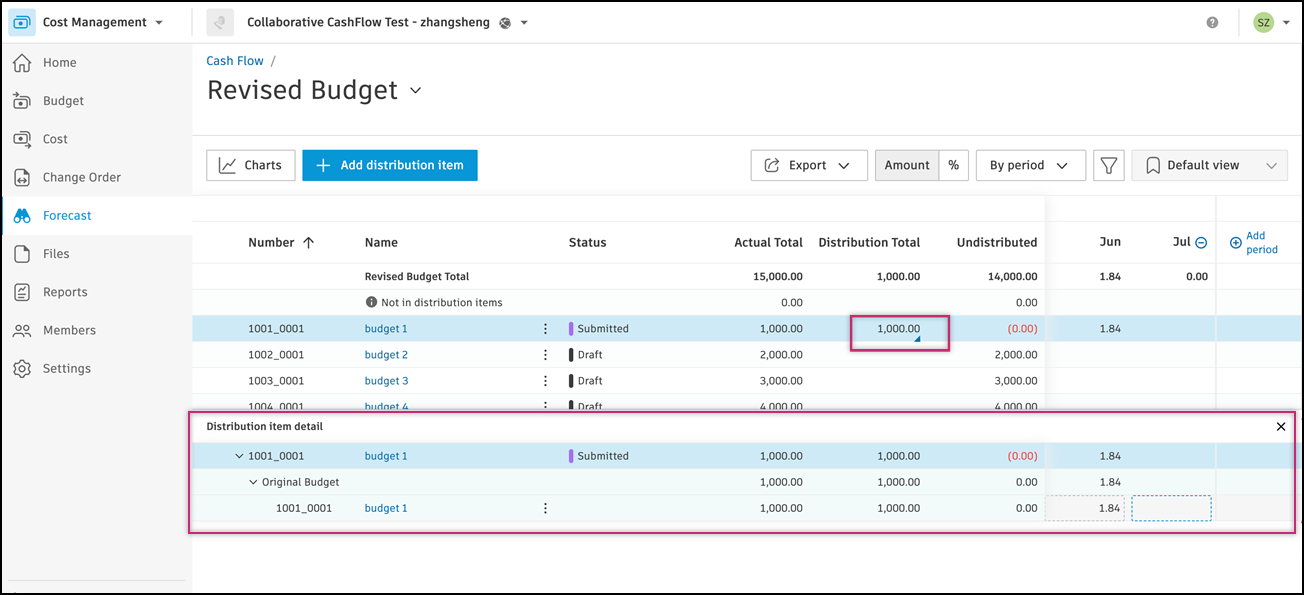
You can now edit the details of an item and see other items.
Related Articles
Forecast adjustments across tools
- In Budget Tool: Create Forecast Adjustments in Budgets
- In Cash Flow Tool: Add Forecast Adjustments (this article)
- Settings: Budget Forecast Configuration
Other forecast tools and workflows
