
View a Plan
Plans can be viewed in a swimlane view or list view.

Swimlane View
The swimlane view displays tasks visually across a timeline.
General Info
The swimlane has rows representing tasks grouped by attributes like company or location, and columns representing the timeline.
Canvas Surface
The swimlane view in the Plan tool has a scrollable and zoomable canvas that allows you to focus on different date ranges.
Group By
In the swimlane view, tasks can be grouped together in rows by attributes like company, location, assignee, WBS, or role.

Grouping allows you to see all tasks assigned to a specific company, location, person, WBS code, or role grouped together.
Orientation Bar
You can switch between different timescale views on the swimlane, like daily, weekly, or monthly views. This changes the column width to show days, weeks, or months.

Undo/Redo
There are undo and redo buttons that allow you to undo or redo recent actions like creating, editing, or deleting tasks.
Time Frames Navigation
You can select specific timeframes to view like days, weeks, or months. This will filter the swimlane to only show tasks within that date range.
You can also jump between timeframes using the buttons at the top. Each jump is equivalent to the number of columns shown, so if 10 days are shown, the jump will move you 10 days ahead.
Movements
You can pan the visible area of the swimlane canvas to scroll it side to side. You can zoom in or out to change the scale and see more or less detail. There is also a Fit to zoom option that adjusts the zoom level automatically to fit the whole canvas within the visible area.
Expand
There is an expand icon that expands the canvas area to take up more space on the screen.
Task Visualization
In the swimlane view, task cards expand to fill the available width for each workday column. On non-workdays, the width stays compact.
When tasks overlap in time, they stack vertically and the row height expands to fit the stacked cards.
Shapes and Icons
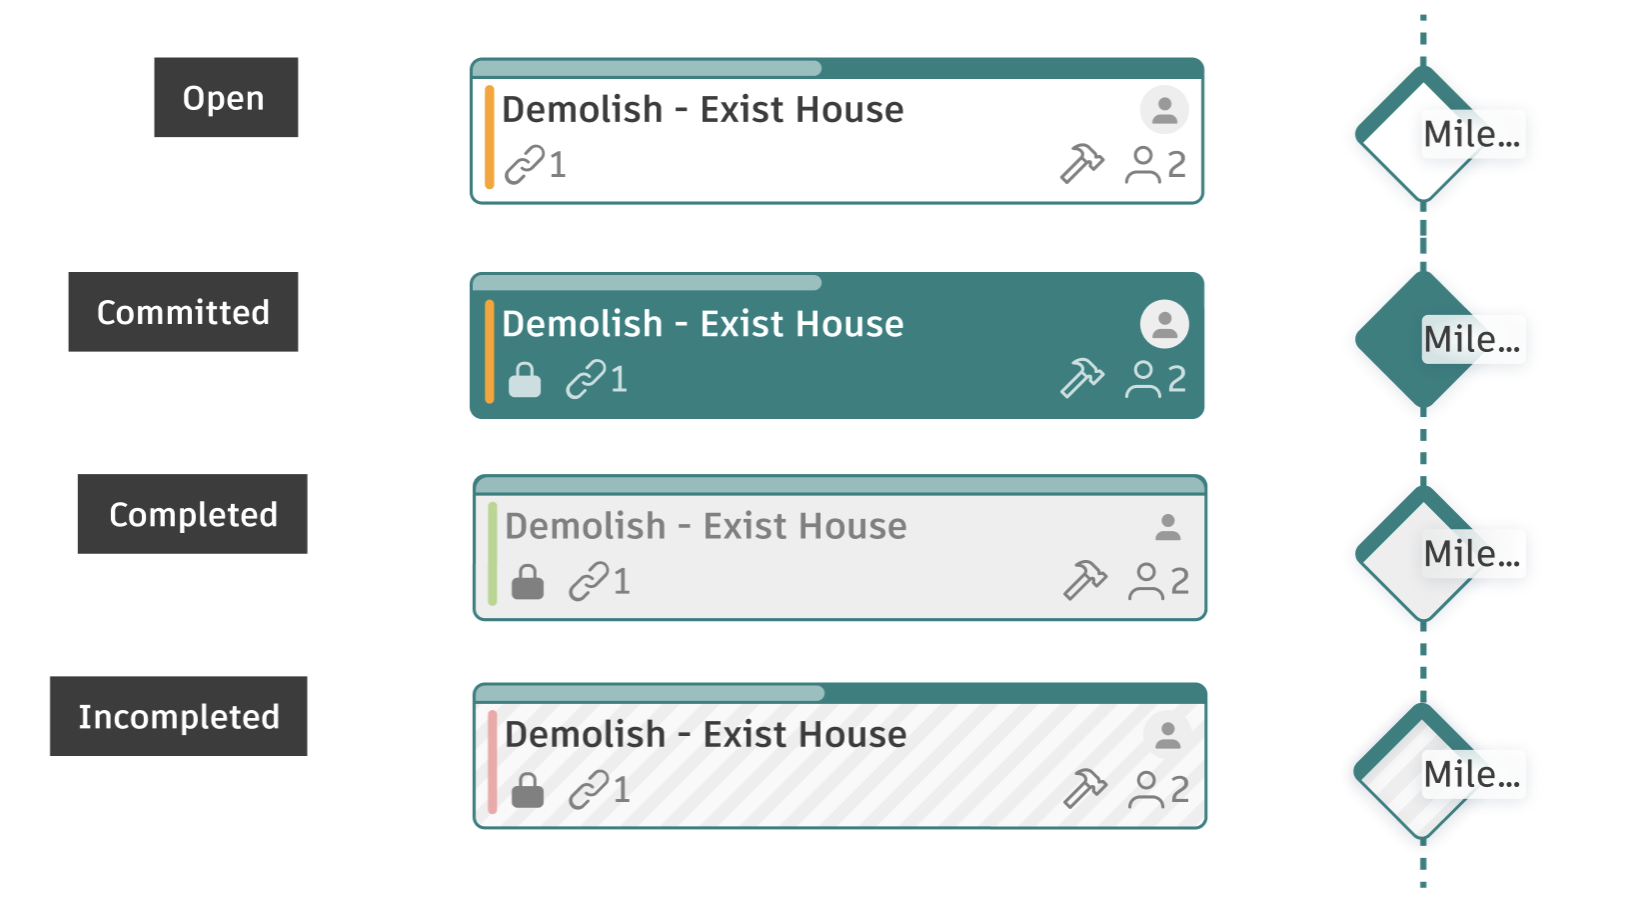
Tasks are represented as cards with shapes, colors, and details based on attributes like status, role, alerts, etc.
Task Card Elements
Task Shape:
- Regular tasks - Rectangular cards
- Milestones - Diamond shapes
Task Colors:
- Status indicator - Colored bar on the left side of the task card:
- Open, In Progress, Work Done, Backlog, Blocked - Status-specific colors
- Completed (not committed) - Full light gray background
- Incomplete - Full background with dashed gray lines
- Company color - The main card background color matches the company's assigned project color
- Tasks without a company assignment display in gray
- Committed tasks - Full company color background (indicating the task is committed)
- Tasks that are both committed and completed show full light gray
- Tasks that are committed and incomplete show dashed gray lines
- Progress Indicator - Displayed at the top of the task card showing the percentage complete (0-100%)
Task Information Icons:
The following icons appear on task cards when applicable:
- Avatar icon - Shows the member assignee's profile picture
- Crew size icon - Displays the number of people assigned to the task
- Work type icon - Indicates the type of work (Work, Delivery, Inspection, Roadblock, Safety, Downtime)
- Comments icon - Shows when comments have been added to the task
- References icon - Indicates linked items (Assets, Files, RFIs, etc.)
- Commitment icon - Appears on committed tasks
- Replanning counter - Shows the number of times a committed task has been replanned (appears as a number badge)
Once a task has been successfully completed, the task card will change to a full light gray background, serving as a straightforward and intuitive way to monitor the progress of your activities at a glance. Committed tasks display with full company color to clearly distinguish them from non-committed tasks.
List View
The list view in the Plan tool displays tasks in a tabular format, with each task represented by a row. The columns in the list view can be configured to show different task attributes like name, dates, assignee, status, etc. The list view allows you to see tasks in a simple table layout, as opposed to the visual timeline layout of the swimlane view.

Parent-child relationships are represented using hierarchy and indentation in the list view.
You can interact with tasks directly in the list view by editing cell values inline.
The list view also enables you to sort, group, filter, and search tasks in a table format.
Export Plan Summary Report
You can generate a comprehensive Excel report containing all tasks within a plan. The report provides a detailed overview of your plan's tasks and their attributes.
To export a plan summary report:
- Click a plan to open it.
- Click the Export button.
- In the Export dialog:
- Enter a descriptive Title for the report
- Choose whether to include a cover page
- Select a destination folder in Files to save the report
- Click Run Report to generate the Excel file.
Navigate Plans

The Contextual Navigation Panel and Breadcrumbs feature is designed to enhance user experience by providing a dynamic and intuitive navigation.
This features is exclusively available for connected plans, ensuring a seamless and integrated workflow.
Metrics Tab
The Metrics tab provides comprehensive insights into plan performance through visual charts and key performance indicators. Access the Metrics tab to:
- Track Percent Plan Complete (PPC) over time
- Analyze PPC by company, location, or WBS
- View root causes for replanning and delays
- Monitor task status breakdowns across different timeframes
- Access a summary box with key metrics like weekly PPC and committed task counts
For more information, see Plan Metrics.
Mobile View
When viewing plans on the Autodesk Construction Cloud mobile application, users can see references added to planned tasks. This feature provides field team members with additional context and insight into elements that affect the schedule, enhancing coordination and decision-making on-site.