
Getting Started with Executive Overview
As a hub administrator, you can grant executive access to members to access the Executive Overview in the Insight tool.
Sections in this topic include:
Access Executive Overview
Select Insight from the product picker.
Click
 on the left panel under Dashboards.
Executives can customize dashboards to add, remove, or reorganize:
- Insight cards
- Branded partner cards
- Blank partner card templates: Used to link to third-party nonbranded application data.
Dashboards
The executive overview provides a view of data across projects or project types. This data is presented as a series of dashboards in the following features:
- Risk
- Cost
- Design
- Quality
- Safety
- Model Analytics
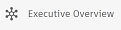
Risk Dashboard (powered by Construction IQ)
Cards include:
- Safety Risk Factors: A summary of the contributing factors to a project's daily safety risk rating.
- Quality Risk Overview: View the total number of projects with high, medium, or low risk.
- Project Risk Trend: View risk by project through time.
- Project Risk: View risk by project.
- High Risk Quality Issues: Understand risk categories on all quality issues (type = Quality)
- Locations: See where all your projects are located on a map.
Cost Dashboard
View a summary of cost information across projects to understand performance and monitor cost overruns. Cards include:
Cost Summary by Project: Shows a summary of all project costs sorted by business unit or project type.
Note: You must have project permissions to view cost details of individual projects.
Design Dashboard
Understand your design risk across projects, project type, and business units. Cards include:
- Design Issues Status by Project: See the total number of open or answered design issues for each project. Issues that are overdue or due within the next five days are highlighted.
- Approval Reviews by Project: See outstanding approval reviews by due date category (overdue, due within the next five days, or due beyond five days) for each project with active reviews.
- Design Risk Heatmap (powered by Construction IQ): Understand the root cause of design issues for each project, including closed issues. Root causes can be filtered by date. Root causes for critical building components are highlighted.
Safety and Quality Dashboards
Cards include:
- Safety/Quality Checklist Activity: Shows the total number of checklists performed over time.
- Safety/Quality Checklist Conformance: Shows the total percentage of passed or failed checklists over time by project.
- Safety Risk Factors: A summary of the contributing factors to a project's daily safety risk rating. This card is added by default to both the Risk and Safety dashboards.
Model Analytics Dashboard
The Model Analytics dashboard provides cross-project visibility into model health, quality, and readiness so executives can identify trends and prioritize follow-up actions.
- Overview: Provides a high-level summary of projects with supported model analytics data available, including the total number of tracked and active projects, projects without recent activity, and disabled projects. The card also displays the number of users contributing data.
- Sync Times: Visualizes synchronization activity, displaying the total number of syncs, average sync duration, and the longest recorded sync time.
- Projects: Displays a table of projects with details such as the last synchronization time and the number of days since the last sync, helping you quickly identify inactive or out-of-date projects.
- Health indicators: A summary of indicators for tracked projects together with status information for each indicator. Click
 for a given indicator to open a project for which you can review the indicator details in the Modal Analytics dashboard. Indicators include:
- Revit links
- CAD links
- CAD imports
- Imported images
- Sync times (in seconds)
- In-place families
- Plan regions
- Families: Information about Revit families used across projects, including family name, type, and number of models used within the family.
- Revit version check: Status information about the Revit version check performed for a given model. Click on a model to access a three-tab dashboard with details such as sync times and file size over time, health score, and historical health score.