About Project Home
This topic includes:
- Project Progress
- Recent Activity
- Quick Links
- Site Weather
- Work Status
- Bridge
- Insight Builder Dashboards
- Construction KPIs in Project Home
Project Home is where you can get a quick overview of what's happening on your Autodesk® Build project.
When you open a project in Autodesk® Build, you'll be taken to Project Home. Here you'll see a series of cards, each with important real-time information about your project.

Project Progress
This card shows your project's progress toward completion, along with any other milestones that have been added to the timeline.
Project start and end dates can be entered when a project is first created. To edit them later on, click the pencil icon next to the completion date.

Milestones
Create milestones for any significant dates on your project. To add a milestone, click Create new milestone and specify the milestone name and due date.

Once added to the project timeline, milestones are visible to everyone on the project.
Recent Activity
Here you'll see a summary of activity on the project from the past 31 days, including updates to sheets and issues. Click Load next 31 days to see activity for another past 31 days.
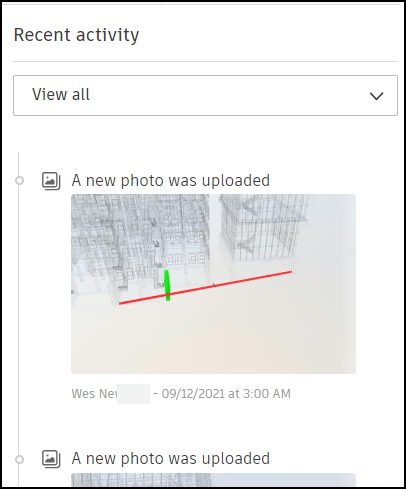
To filter the Recent Activity log, open the drop-down menu and select among Sheets and Issues.
Try clicking links in the Recent Activity card. They'll bring you directly to the sheet or issue being referenced.
Quick Links
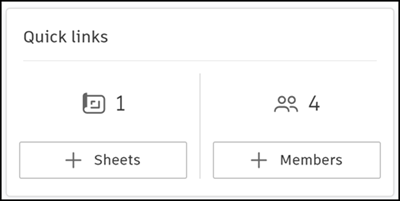
The Quick Links card gives you shortcuts to the project's sheets or members page.
The number next to the sheets icon indicates how many sheets have been published on the project and only includes current versions.
The number next to the members icon indicates how many team members are on the project.
Jump directly to the Sheets tool by hovering over the sheets icon and clicking View. To go directly to the sheet upload process, click Sheets. To add more team members, click Members.
Site Weather
Weather for your project is displayed based on the project's address. Click "Show more" to view the five-day forecast. Click "Detailed Forecast" for even more information about the weather on your jobsite.

To change whether temperature is displayed in Celsius or Fahrenheit, change the locale on your device and browser.
Work Status
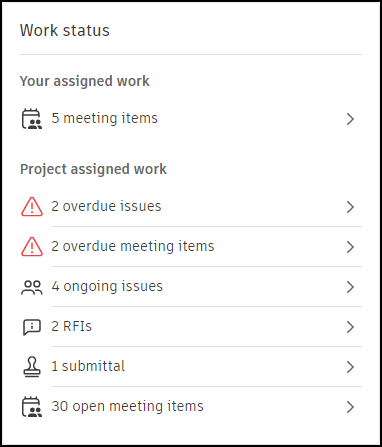
The Work Status card gives a quick summary of overdue and outstanding issues, submittals, and RFIs on your project. It also shows your assigned work as identified with meeting items and any other open meeting items. Click any of the items in the card to go directly to the associated tool.
Bridge
On the Bridge card, you can view a record of recent outgoing sheets the project has shared with other projects, and recent incoming sheets received from other projects. You can click any of these recent sheets to view a details page for that shared file package and its sheets.
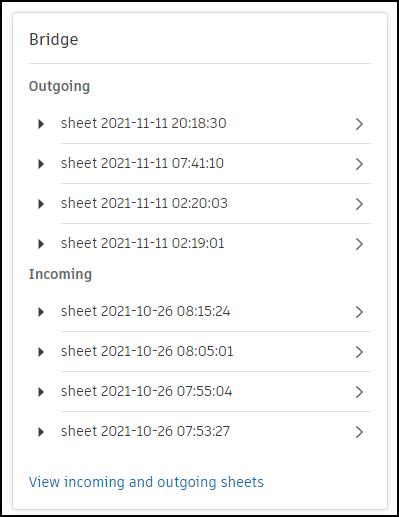
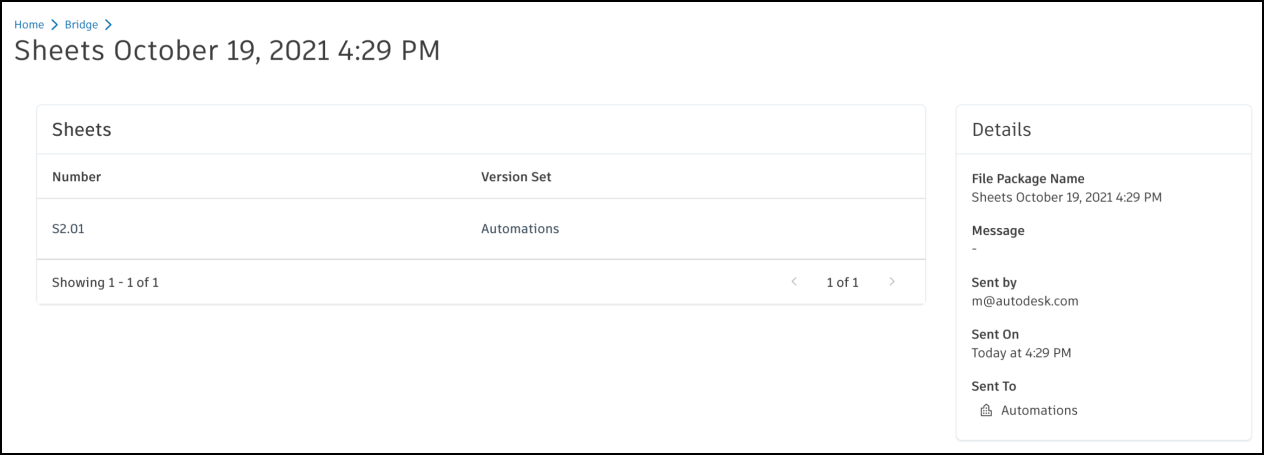
From the Bridge card on Project Home, click View incoming and outgoing sheets to open the Bridge page. This page lists all file packages for the project that have been shared with other projects, file packages received from other projects, and any automatic updates set up for shared files in the project. Learn more about using Bridge to manage for sheets shared Between projects.
Learn more about sharing sheets with other projects in Share Sheets and Bridge for Sheets Shared Between Projects.
Insight Builder Dashboards
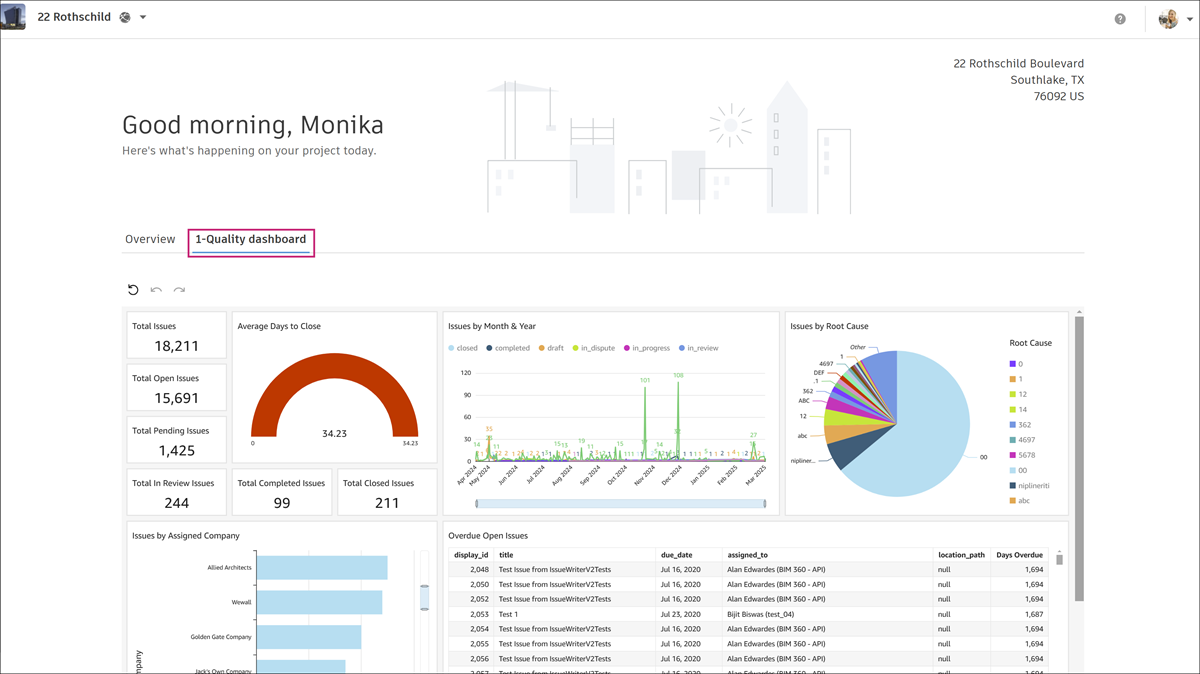
Any Insight Builder dashboards that are shared with project teams appear as tabs on Build Project Home.
Learn more about sharing dashboards with project teams in Insight Builder.
Construction KPIs in Project Home
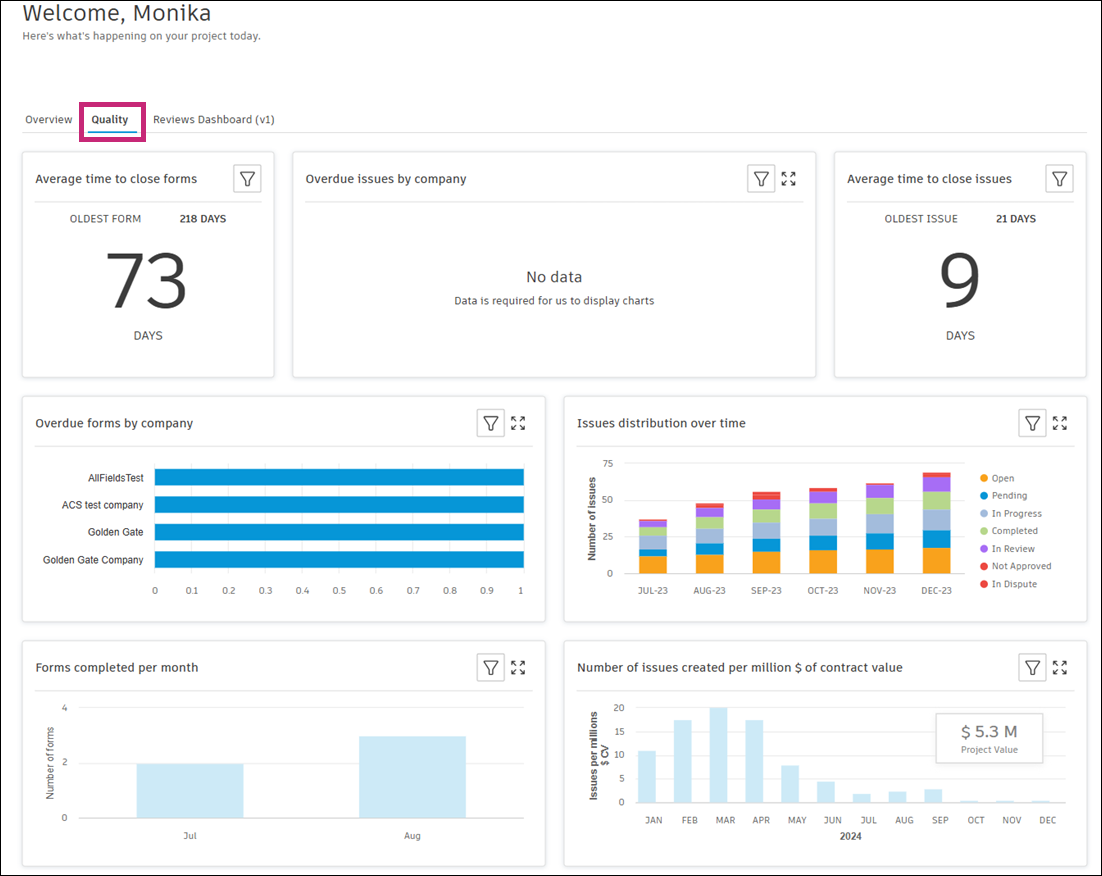
Project Home provides construction KPIs and metrics to help you monitor project quality and improve outcomes. These KPIs are designed for project managers, superintendents, and QA/QC managers, offering timely insights into field quality control.
Access KPIs
Click the Quality tab in Project Home to display construction KPIs and metrics.
KPI Dashboard Features
KPI cards are displayed in a fixed order based on priority
Each KPI is presented as a separate card
Click the Filter icon
 in the upper right corner of each dashboard to apply filters. Filters vary by KPI type and may include:
- Date range
- Issue status
- Issue category
- Assignee
- Creator
- Location
- Submittal status
- RFI status
Click the Expand icon
 available in the upper right corner of some dashboards to view the KPI in full screen.
Click the sort icon
 in the upper right corner of each dashboard to sort summary tables for more targeted analysis
Each card shows the last updated time for its data
The dashboard layout is static and cannot be customized.
