
Configure Interactive Sheets in Insight Builder
When you create an analysis, you are prompted to select a desired sheet type: an interactive sheet or a pixel-perfect report. This topic discusses how to configure an interactive sheet.
An interactive sheet is a collection of data expressed in visuals that can be interacted with once the sheet is published to a dashboard. When you select it as an option, you'll be building and arranging visuals on an interactive dashboard.
You can customize the type of layout that you want for visuals in your interactive dashboards. You can also create parameters and custom actions to add interactivity to dashboards.
See Working with Interactive Sheets in Amazon QuickSight to learn more.
Add Visuals to Interactive Sheets
Select Analyses from the left navigation.
Click the relevant analysis.
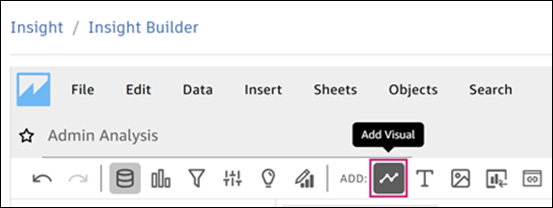
Click the Add Visual icon in the toolbar.
Click the visual that you'd like to add.
This action opens the Visuals and Data panels on the left.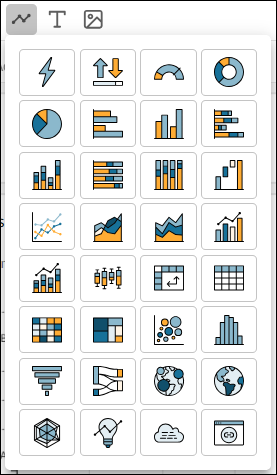
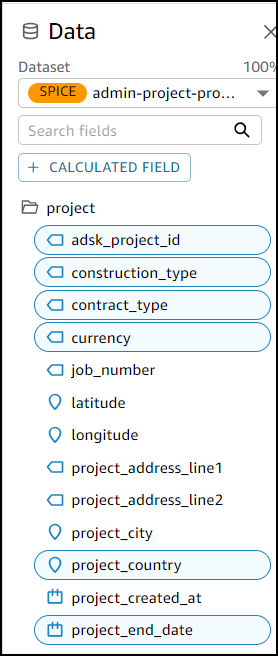
In the Data panel:
Use the Dataset drop-down list to select the desired data, add a new data set, or manage datasets.
Click
 to add a calculated field. When you choose this option, you are prompted to configure settings for fields, parameters, and functions. Click Save to complete.
Select the desired data fields from the Data panel.
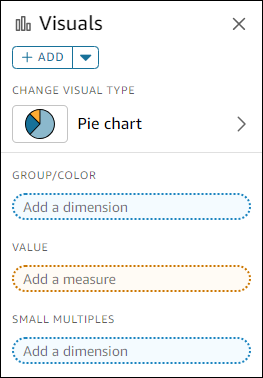
In the Visuals panel, configure the settings for your visual as required.
Add another visual
Change visual type
Add dimensions, measures, and group the visuals
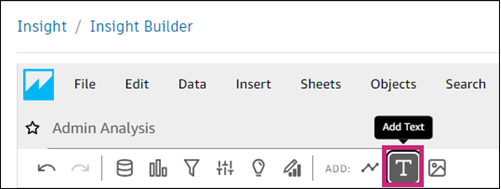
Add Text to Interactive Sheets
Click the Add Text icon in the toolbar.
Enter your text.
Tip: You can choose from a variety of fonts, font sizes, color formatting options, and add links to images.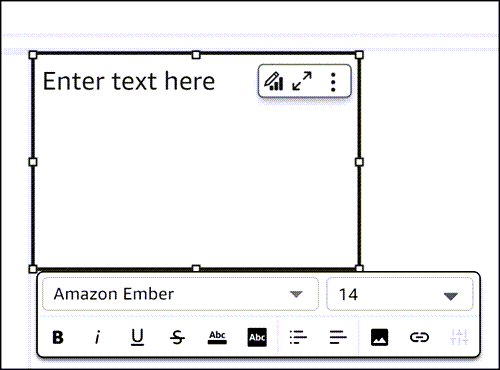
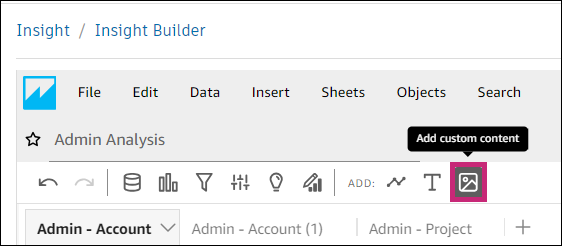
Add Custom Content to Interactive Sheets
Click the Add custom content icon from the toolbar.
This action opens the Data and Visuals panels. Configure the settings in each panel as needed.
To customize a visual, click Customize visual
This action opens the Properties panel on the right. The panel is made up of two tabs: Visual and Interactions.Visual tab:
- Display Settings: Edit and show/hide title and subtitle.
- Custom Content: Enter a URL for the visual. Toggle on/off the Show as image option.
Interactions tab:
- Actions: Click Add action to configure settings for a custom action.
Customize Dashboard Layout
Customize the layout of your dashboard to organize your project data in a way that best fits your needs.
In Insight Builder, click Analyses from the left navigation.
Click the desired analysis.
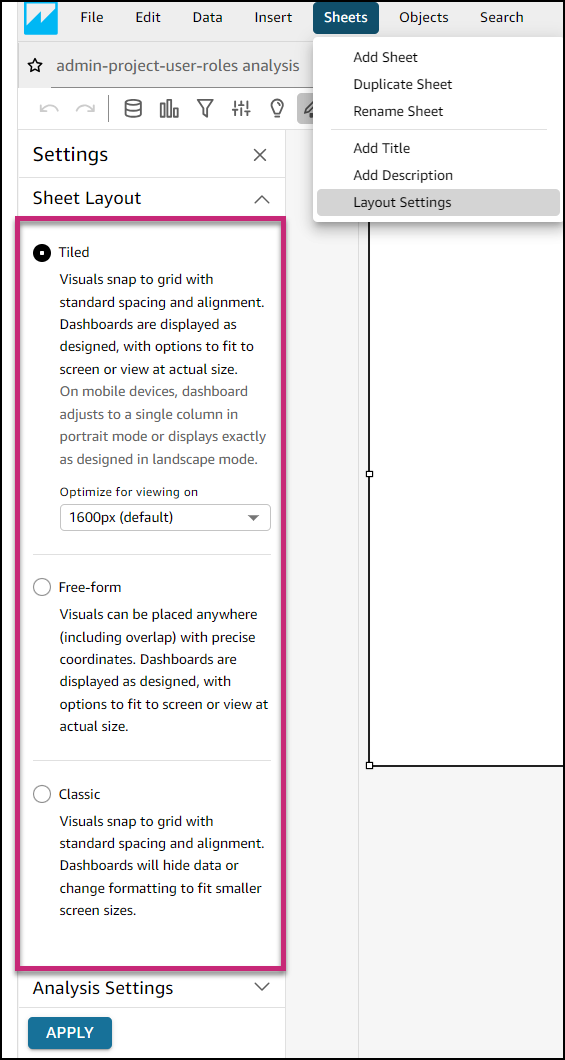
Click Sheets > Layout Settings to open the Settings panel.
Select a desired layout type.
Configure analysis settings as required:
- REFRESH: Choose to toggle on/off reload visuals each time or update visuals manually
- DATE AND TIME: Toggle on/off convert time zone and select desired start of the week
Click Apply.
Add Interactivity to Sheets
You can add interactivity to your sheets by setting up parameters and adding custom actions. Parameters are variables that make it possible for users to interact with dashboards.
Set Up Parameters
Parameters are named variables that help users interact with dashboard features in a less technical way by transferring a value for use by an action or an object. Learn more about parameters here.
To create a parameter:
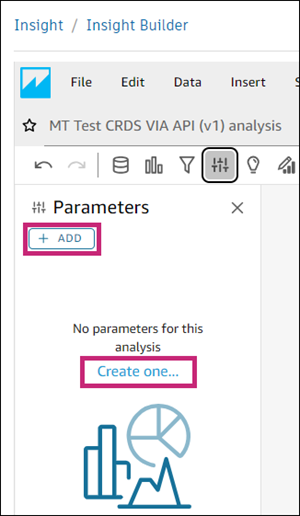
Click the Parameters icon
 in the toolbar in the upper left of the page.
Click Add or click Create one to create a parameter.
Fill out all necessary details and select desired configuration options.
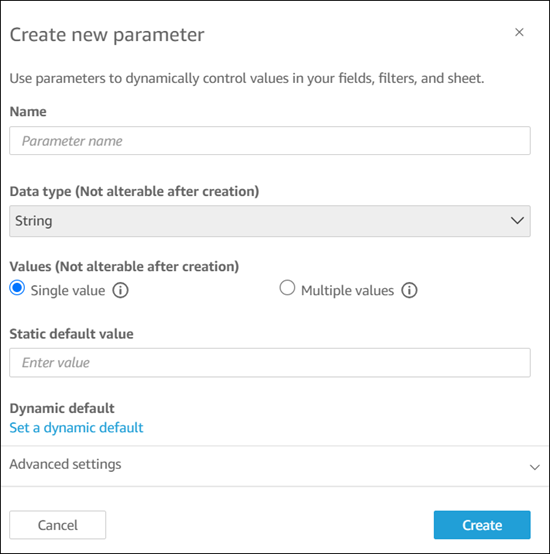
Click Create.
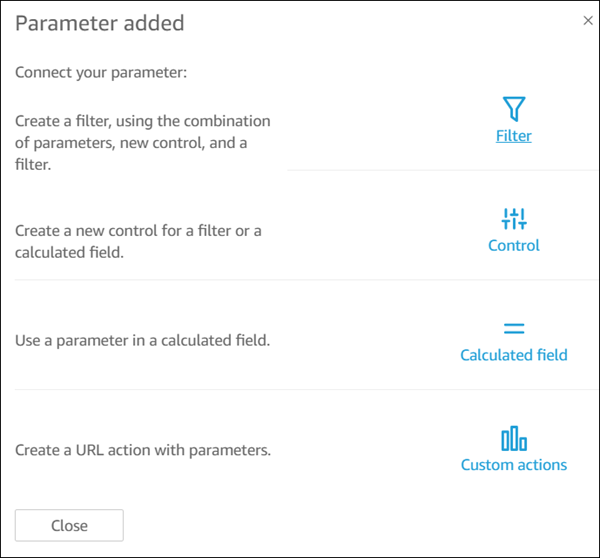
Connect your parameter by configuring its filter, control, calculated field, and custom actions.
Add Custom Actions
Create custom actions on one or more visuals in your analysis. Custom actions help users explore data by adding more context from within the dataset.
Learn more about custom actions here.
Click the More menu
 in the top right corner of the sheet for which you want to configure a custom action.
Click Actions.
This action opens the Actions panel on the right.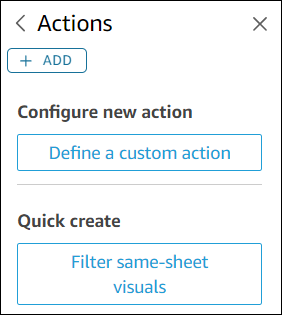
The following action types are available:
Click Add or Define a custom action to specify a new action.
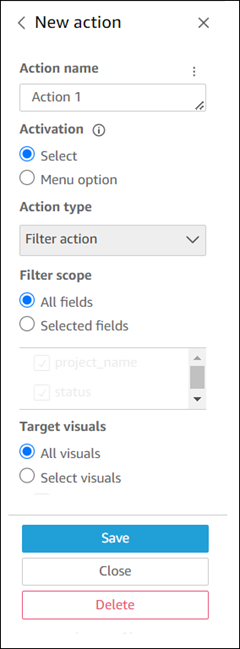
- Filter scope: You can filter on all fields or choose the items you don't want to target.
- Target visuals: You can filter on all widgets or turn off the items that you don't want to target.
URL action: Enter the URL to open. You can choose where you want to open the URL: New browser tab, Same browser tab, or New browser window.
Navigation action: Select the target sheet and set up parameters to send to the target URL. Parameters' names start with $.
Learn more about custom actions here.