Create and Configure Pixel-Perfect Reports
When you create an analysis, you are prompted to select the desired sheet type: an interactive sheet or a pixel-perfect report. This topic discusses how to configure a pixel-perfect report.
![]()
You can also add pixel-perfect reports to an existing analysis and create reports from an existing interactive sheet. See Create Pixel-Perfect Reports from an Existing Interactive Sheet to learn more.
Pixel-perfect reports are multi-page, highly formatted documents that allow for incorporating elements like page breaks, headers, and images.
Add a new Pixel-Perfect Report to an Existing Analysis
Click Analyses from the left navigation in Insight Builder.
Click the relevant analysis.
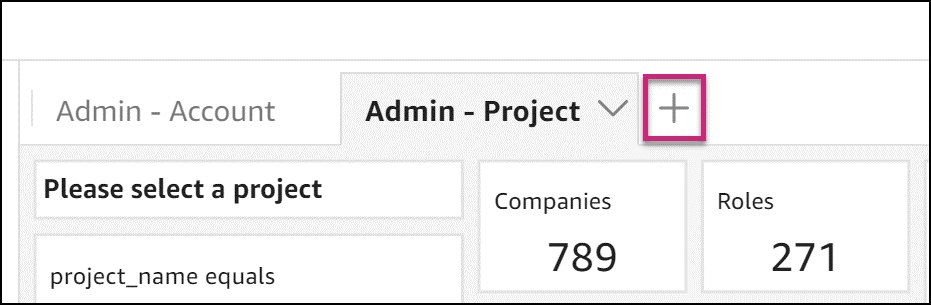
Click the Plus icon next to an existing sheet to add a new sheet.
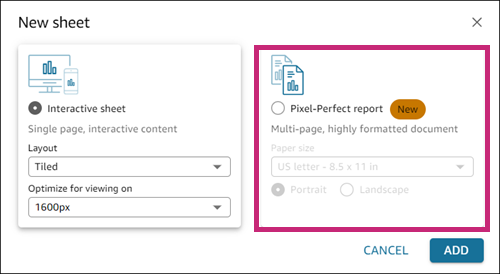
Select the Pixel-Perfect report option, and click Add.
Configure your report as needed:
Edit header by applying desired padding configuration
Edit section by applying desired padding configuration
Edit section by configuring it to repeat for each dimension value
Move report sections
Delete header and section
Create Pixel-Perfect Reports from an Existing Interactive Sheet
Click the drop-down menu next to the sheet name.
Click Duplicate to report.
Tip: You can use other options available in the menu to rename, duplicate, or delete a sheet.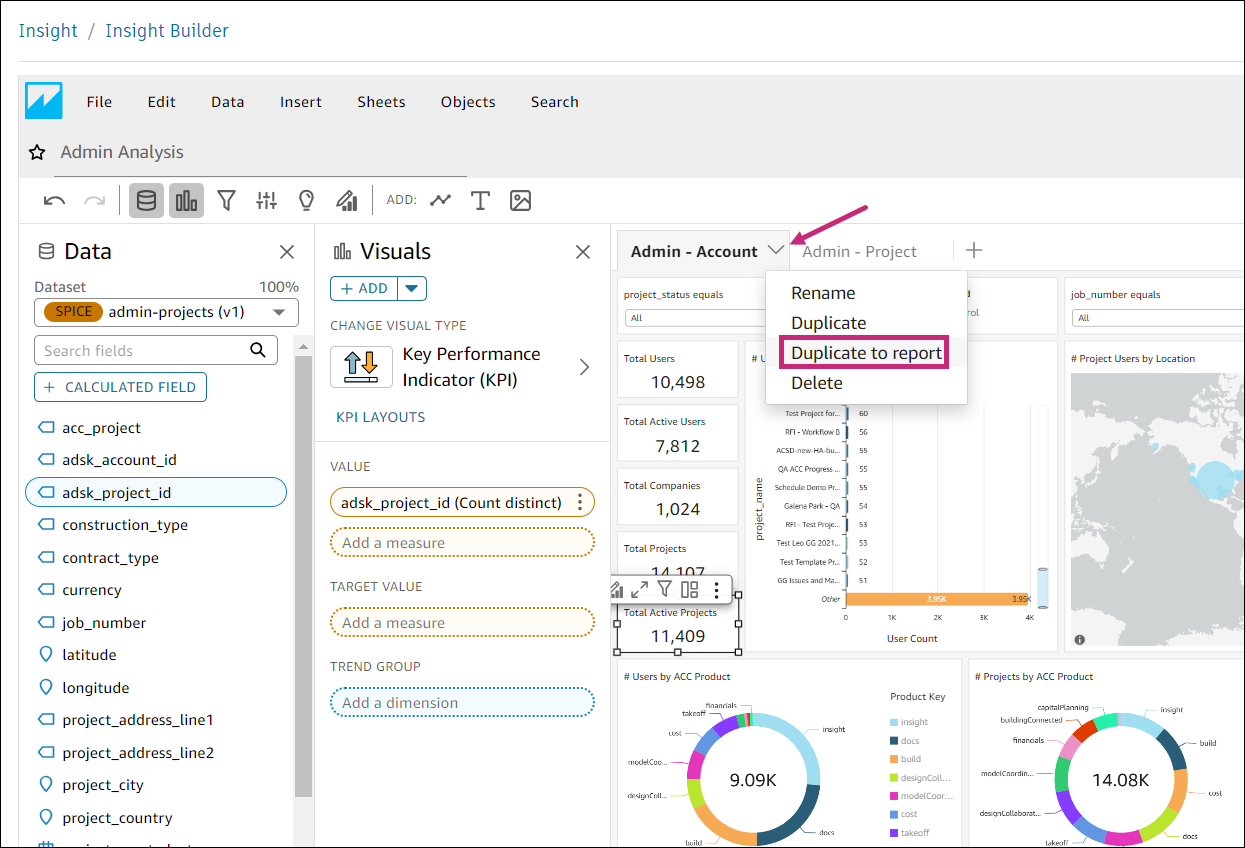
Configure Pixel-Perfect Reports
Learn how to work with report sections, add and delete visuals, add page breaks and text boxes, and otherwise work with reports.
Add, move, and delete report sections
Every pixel-perfect report needs at least one section. You can add multiple sections to group different sets of visuals together. The report section contains different visuals that grow vertically to contain contents.
Add report sections
Click the sheet containing the report to which you want to add a section.
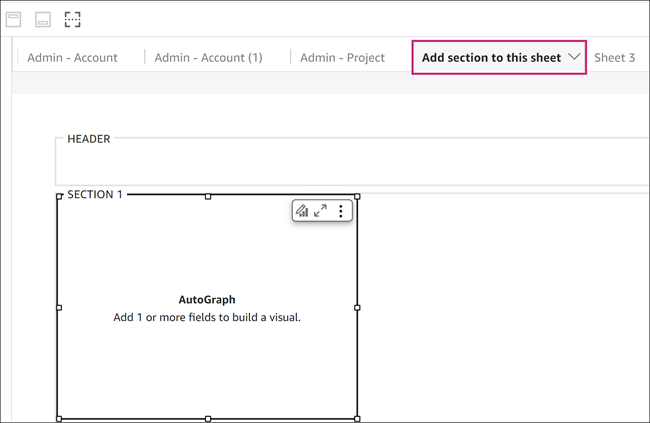
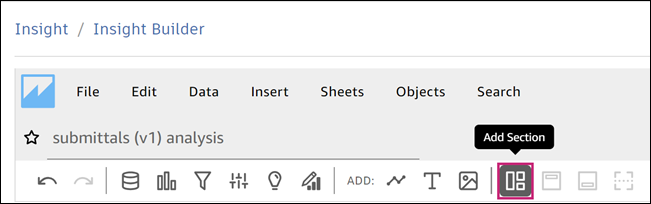
Click the Add Section icon in the toolbar.
 Note: A new section is added to the bottom of the report.Tip: Add a section by hovering over a page break marker. See Add and remove page breaks for more information.
Move and delete report sections
Navigate to the section that you want to move.
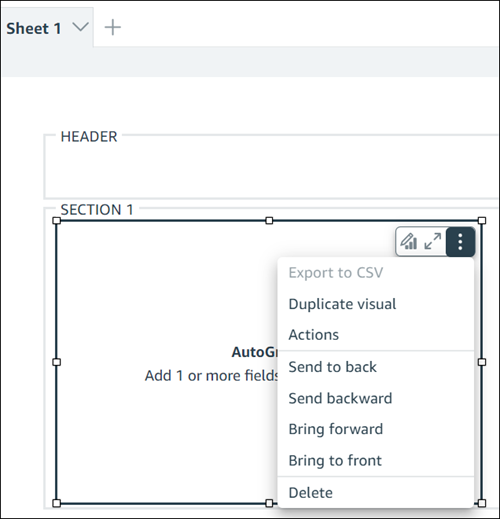
Click the More menu
 in the upper right corner to open the on-section menu.
Click a desired action listed under Actions. The action can be one of the following:
- Send to back
- Send backward
- Bring forward
- Bring to front
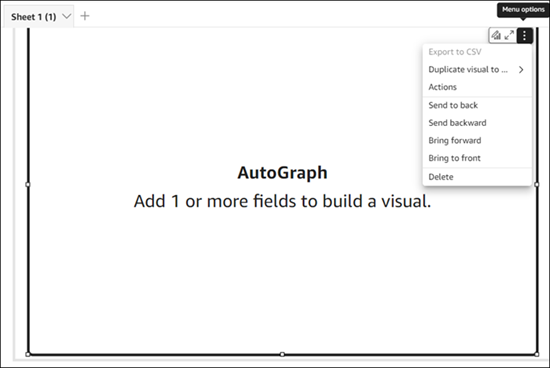
To delete a section, from the on-section menu click Delete.
See Working with sections for more information.
Add and Delete Visuals
You can add various visuals to present your report data in a visually appealing way.
Click the Add Visual icon in the toolbar.
Click the visual that you'd like to add.
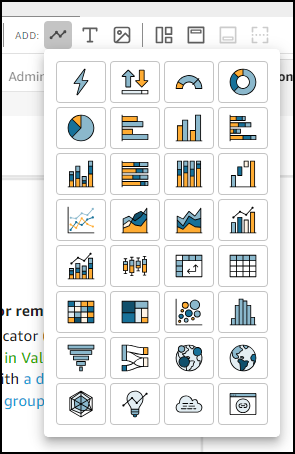
This action opens the Visuals panel.
Configure the settings in the panel as needed.
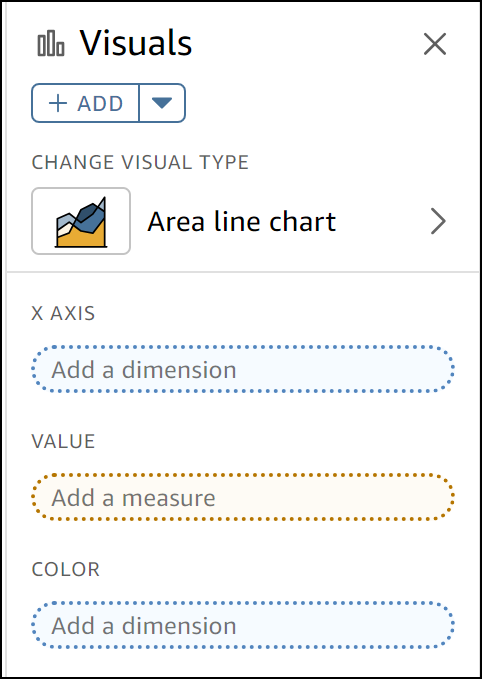
Table considerations:
- A table must be put in a separate section to print across all the rows in that specific table
- Visuals should not be included because they will overlap with the table and result in incomplete data being printed
- If you add a table to an interactive sheet, it will only print the viewable rows rather than the entire table
Learn more about adding and deleting visuals to a report.
Add and Remove Page Breaks
Page breaks help organize the way data is rendered when the report is published by page.
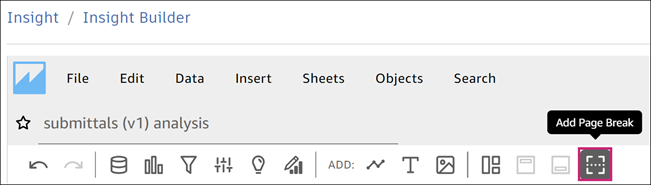
To add a page break, click the Add Page Break icon in the top toolbar.
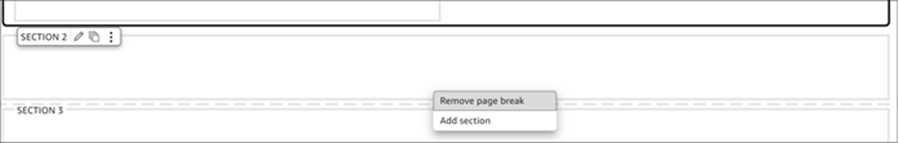
To remove a page break:
Hover over the middle part of the page break marker.
Click the Plus icon.
Click Remove page break.
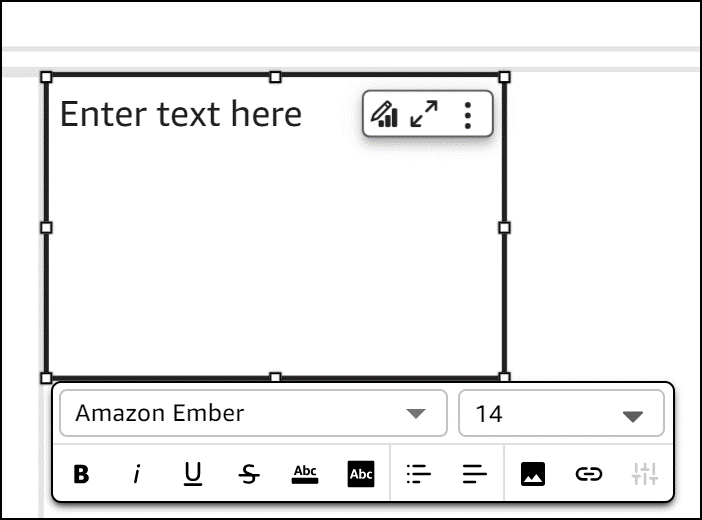
Add Text Boxes
Navigate to the section to which you want to add a text box.
Click the Add Text icon in the top toolbar.
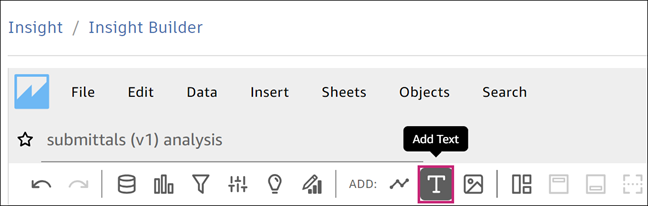
Enter desired text.
Tip: You can choose from various fonts, font sizes, color formatting options, and add links to images.