
After Data Import
If you are still having issues with slow performance or InfraWorks not responding, open your Windows Task Manager to get a sense of what is going on.
The Performance tab can help with this.
- If the CPU appears idle, select the Process tab of the Windows Task Manager and find the "InfraWorks.exe" process.
- Even if your CPU activity shows 0% on the Performance tab, you can modify viewing options in the Process tab to include the IO Read/Write Bytes columns, which can indicate if InfraWorks is busy writing to disk.
- If InfraWorks.exe is writing hundreds, thousands, or millions of bytes/second, you will need to give the application more time to finish generating tiles and/or rendering.
If your model has finished generating but you still experience less-than-ideal performance, there are a few things you can do to clean up your model.
- First, check the frame rate in your model in real-time while toggling visibility on/off for different data layers. This will give you an idea about which data sources have the biggest performance impact on your model.
- You can also run a rendering performance check on your model for further diagnosis:
To run a rendering performance check on your model
Open the Model Explorer (keyboard shortcut Alt + 3).
Click


 to display the frame rate counter in the bottom-right corner of your screen.
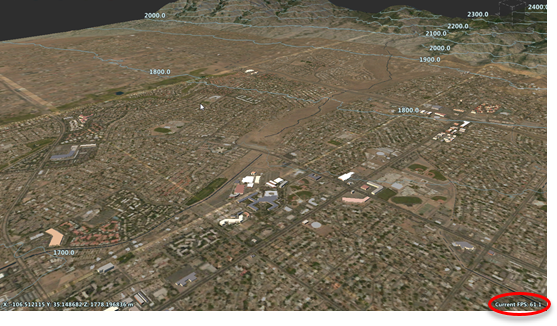
Turn off visibility for your layers one at a time, comparing the differences in frame rate. After changing visibility for each layer, pan/zoom/orbit around your model and note the average and outlier frame rates. Do this for each layer. If toggling visibility for a certain layer produces a particularly strong difference in frame rate, you know that the data contained in this layer has the biggest performance impact.
Note: Complex rendering computations such as shadows are slowed down or skipped if the camera doesn't move. To verify performance impact more precisely, you could run a render performance check (Ctrl+Alt+Shift+P). If you have turned on animation, such optimizations cannot be applied as the view is changing constantly. Thus, turn off animation to further optimize performance.
- If 3D model objects are slowing performance, re-import all 3D model objects with model handling set to "Dynamic LOD."
- If 3D model objects contain large associated texture files, back up your model data, open the texture files in a photo-editing application, resize the textures to a smaller resolution such as 512x512 or 1024x1024, and overwrite them. Then reimport the 3D model objects.
- If your terrain layer is slowing performance, experiment with Terrain Simplification settings in Application Options. You can make adjustments after import if you are not satisfied with the level of simplification you specified before import.
- Consider hiding (turn off visibility for) data layers that are affecting performance.
- Consider decreasing the extent of your model further (if your project goals allow this), to reduce overall complexity/size.
Run a render performance check on your model (Ctrl+Alt+Shift+P) to diagnose how the addition or removal of certain objects impacts model performance.
For example, you could run the tool with a stand of trees in the view, then remove the trees and run the tool again. Or, run the performance check on the view without an object selected, then select a component road and run it again. Use this tool to gauge rendering performance from within the model for:
- features inside the view
- specified graphics settings
- specified states of selection
Information displays the time to render the full view and the average frame rate per second. This check simulates rendering 100 frames as if the camera would be constantly moving. This way you can see how performance of your model evolves in the worst case, without any optimizations. However, the result will be independent from your current application graphics settings, but dependent on your machine hardware settings. This way you can compare performance results for different models and bookmarks per machine.
Note: For quick comparison testing, use a bookmark to repeat the test at a specific position in the model with different settings.
Example
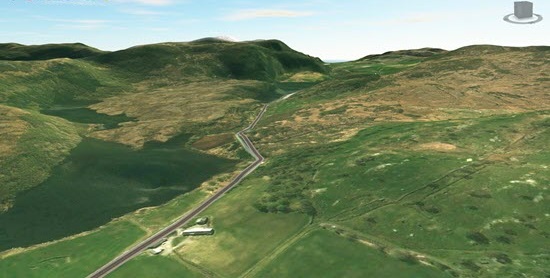
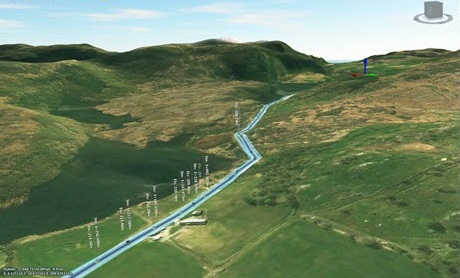
In this example we'll look at the performance results for a model view without an object selected and then with a road selected. The impact of a small visual change can significantly affect performance.
Note: The example is measured with NVIDIA Quadro K4000 and Intel Xeon 2.6 FHz (2 processors).
Without an object selected, the performance test results for time to render and frames per second are 3.9s, 25.4fps.
With a road selected, the performance test results are 8.5s, 11.7fps.
So what is a "good" frame rate for InfraWorks?
The definition of a "good" frame rate depends on individual expectations as well as on the application use case. In InfraWorks, you may require at least 12fps to enable navigation through your models.