
The Graph Selection dialog is displayed when viewing simulation results using the graph selected objects tool
 on the
Tools Toolbar. The graph selected objects tool is used to display results for more than one network object on the same graph.
on the
Tools Toolbar. The graph selected objects tool is used to display results for more than one network object on the same graph.
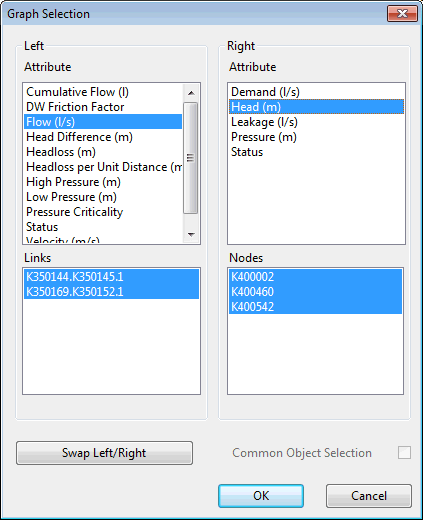
The following options are available on the dialog:
| Attribute List | The upper list in the Left and Right boxes lists parameters that can be graphed. |
| Object List |
The lower list in the Left and Right boxes is the Object List. Before opening this dialog one or more network objects must be selected. These two lists display the objects that have been selected.
Please note that the object names displayed in the list are configurable from the Configure Display Rules dialog. |
| Swap Left/Right button |
Use this button to switch the Left and Right lists and so switch the axes on which the data will be displayed. |
| Common Object Selection check box |
This box becomes active when selected network objects are of the same type. When this box is checked, selections in the right hand list are synchronised with those in the left hand list. When objects are selected or deselected in either list the change takes effect in both lists. To split the lists uncheck the box. |