
Histogram Plot
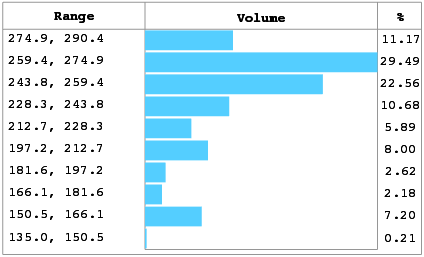
The Histogram Plot provides a visual representation of the distribution of data, enabling you to analyze and interpret results more effectively.
The histogram plot is supported for the following mesh type:
 3D
3D
and for select results.
Note: The histogram plot is not supported for results that contain 1D beam elements, for example in runner systems. Place the runner system on a separate layer and hide it to enable the histogram plot.
You can click individual bars of the histogram to filter the data, so you can focus on specific areas of interest. You can also move and resize the histogram for flexible usage. To reset back to full range, right click the histogram and select Show full display.