
Compression molding analysis results
This help topic specifies the results for an Injection-compression molding or Compression molding analysis.
Text based results
The following table lists the text results generated for an Injection-compression analysis.
| Results |
|---|
| Analysis log |
| Results Summary |
Filled (or Fill) Volume %
At the start of the Filling Phase, a table is written to the Analysis Log. For models with 3D meshes, the Filled Volume (or Fill Vol) % column shows the volume of polymer charge at any given time, expressed as a percentage of the volume of the part mesh.
In the illustration below, V1 represents the volume of the charge for a compression molding analysis. For injection-compression molding, V1 is barely greater than zero (0). V2 represents the volume of the modeled part, and therefore remains constant throughout the analysis.
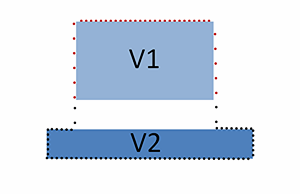
Figure 1 Illustration of V1 and V2 in Filled Volume %
The filled volume (FV) %, at any given time, then, is given by the equation:
FV = V1 / V2 * 100
In compression molding analyses, the initial polymer charge volume will be close to, or greater than, the volume required to fill the part. The Filled Volume % will therefore be close to, or greater than 100%. This simply means that there is more polymer available than is required to fill the part. It does NOT mean the part is filled.
In injection-compression molding analyses, the initial polymer charge volume will be close to zero (0). The Fill Vol % will, therefore, be close to zero (0).
As the press moves down and approaches the end of the press open distance, and the pressure on the polymer increases, the density of the polymer increases which reduces the Filled Volume %. Thus, in compression molding analyses, the Filled Volume % at the start of the analysis could be greater than the Filled Volume % at the end of the analysis.
Filled Nodes %
The Filled Nodes % result gives an indication of what percentage of part nodes, that were unfilled at the start of the analysis, are now filled. If the nodes are evenly distributed through the part, this gives a good indication of what percentage of the part has filled. If the nodes are not evenly distributed, and there are some areas with a high node density and some areas with a low node density, the Filled Nodes % is not a good indicator of how much of the part has filled.
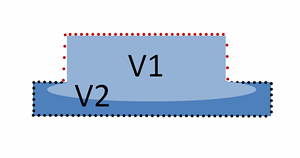
At the start of the analysis, the part mesh is stretched upward to accommodate the polymer charge and to provide a representation of the compression press surface. The nodes in contact with the initial charge, shown in red, are considered to be filled at time t=0, and the Filled Nodes % result is equal to zero (0).
Figure 2 Illustration of the node filling process
As the press moves down, the mesh is returned to the part shape, and the polymer is displaced into the part mesh, including sideways if there is space. During this process, the nodes that are stretched over the polymer charge slowly revert to their original positions, and additional nodes are filled. The Filled Nodes % result indicates the percentage of additional nodes that have filled since time t=0.
Short shot
A short shot is declared if the analysis clock time is greater than the (press start time + press compression time + curing (or cooling) time). If the short shot is detected before this time, the cooling (curing) time will be reduced to match the cycle time.
Graphical results
The following table lists the graphical results that are generated and indicates whether each result is supported for the following analysis technologies:
 Midplane
- Thermoplastics Injection-compression molding
- Reactive Injection-compression molding
 3D
3D- Thermoplastics Injection-compression molding
- Thermoplastics Compression molding
- Reactive Injection-compression molding
- Reactive Compression molding
For more information about a result, including how to interpret the display, click on the result name.
