
Visualizing results of a study
In this task, you will learn how to open an Moldflow Results file (*.mfr) and visualize results of a single study.
If the Autodesk Simulation Moldflow Communicator Launch Wizard is enabled:
The Choose result file page opens.
In the Select Moldflow Results file (.mfr) area, click
 *Browse**.
The Select File dialog appears.
Alternatively, you can choose a file from the list in the Most recently viewed files area, if available.
Navigate to the file location where you saved the downloaded tutorial files, select select amc_tutorial.mfr, then click Open.
Click Next.
The Select Action page appears.
Select Visualize Results from the list of actions.
Note: You could select either Compare Results or Quantify Results actions directly at this point. However, we will examine these actions in subsequent steps of this tutorial.Click Finish.
The wizard automatically opens the first study in the selected result file and displays its first result in the graphics window.
Alternatively, if the Autodesk Moldflow Communicator Launch Wizard is turned off,
Click File > Open Project
The Open Project dialog appears.
Navigate to Download Moldflow Communicator, and select an example *.mfr file.
Click Open.
The tutorial project is displayed in the Project View pane of the Tasks tab.
Double-click on the first study name to open it.
The results included for the selected study are listed in the Study Tasks pane. The first result is displayed automatically. In this case, the first result displayed is Fill Time.
Use the
 (Home tab > Animation panel > Animation tools) to animate this result and see how the fill pattern changes over time.
Click the Logs checkbox to display textual information related to the analysis.
Click the checkbox next to each result name to display that result. When the Dynamic Help pane is open, help for the selected result appears automatically. Click View tab > Windows panel > User Interface, then select Dynamic Help to turn this pane on or off. Look in the Plot Note pane to see descriptive notes that may have been included by the creator of the result file for each result.
Tip: To display the Notes pane, click on View tab > Windows panel > User Interface, then select Notes from the drop-down menu.Display the Circuit coolant temperature result. Note that this result is only valid for the cooling channels. No values for this result are displayed on the part itself.
Display the Temperature, mold result. The Plot Notes pane displays information about why this result is important.
Use the
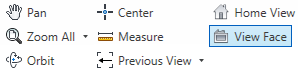 (View tab > Navigate panel > Navigation tools) to manipulate the model in the graphics window until you can see the areas where heat is concentrated in the deep corners.
Display the Deflection, differential cooling: Deflection result. Note the degree of warpage in the handle area.
Use the
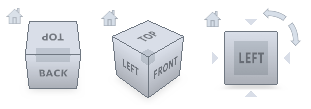 ViewCube to manipulate the model and see the total deflection more clearly. You can also display the deflection component in the direction of the X, Y or Z axis.