
An introduction to the windows, ribbon, and other controls used in PowerInspect.
When you have selected the CAD model you want to work with, it is displayed in the PowerInspect screen, together with the tabs you need to create, run, and manage an inspection. For example:
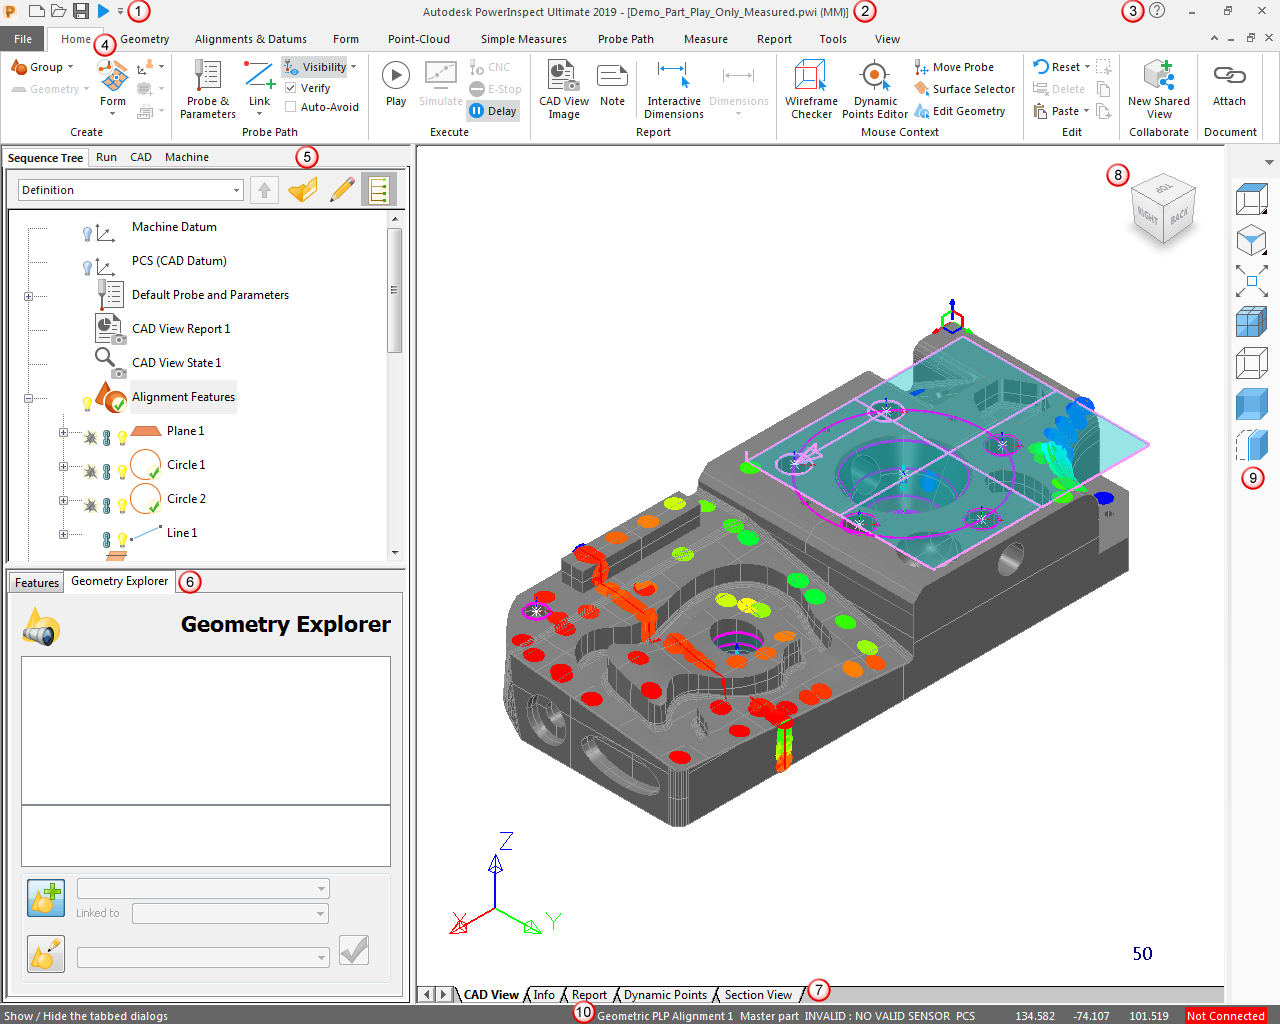
 Quick Access Toolbar — Use the Quick Access Toolbar to access frequently used commands.
 Title bar — The Title bar displays the current version of
PowerInspect, the name of the current document, and the units.
Title bar — The Title bar displays the current version of
PowerInspect, the name of the current document, and the units.
 Help — Click the Help
 icon to display the Help menu.
 Ribbon — The ribbon comprises several tabs, each of which represents a subset of program functionality. The tabs contain panels of related commands.
 Side-panel, upper tabs:
- The Sequence Tree tab contains the inspection sequence. It specifies the items to be measured and the order in which they are to be measured.
- Use the Run tab to simulate and run the inspection sequence.
- Use the CAD tab to load, manage, and delete CAD models, and to view the details of model files.
- Use the Machine tab to view and calibrate the measuring device to which PowerInspect is connected.
 Side-panel, lower tabs:
- Use the Features tab to view and change the details of items in the inspection sequence.
- The Geometry Explorer tab displays the details of features selected from the CAD model using the Wireframe Checker.
 Graphics area tabs — Use the Graphics area to view the model and your measurement data. It has several tabs:
- Use the CAD View tab to view and manipulate CAD models and inspection data.
- The Info tab displays the details of the currently selected item in the inspection sequence.
- The Report tab displays an HTML report for all the items in the inspection sequence.
- Other tabs, such as the Section View tab, Dynamic Points tab, and Point Cloud tab display the details for specific types of item that can be added to the inspection sequence.
 ViewCube — The ViewCube shows the current viewpoint for the Graphics window. When you re-orient the view using the View tab or a keyboard shortcut, the ViewCube automatically rotates to reflect the new viewpoint. You can also use the ViewCube to manipulate the view directly.
 View toolbar — Use this toolbar to access frequently used view commands. To show or hide this toolbar, click View tab > Window panel > View Toolbar.
 Status bar — The status bar displays information about the alignment, coordinates of the cursor in the Graphics area, and the status of the machine connection.